Download
1 / 29
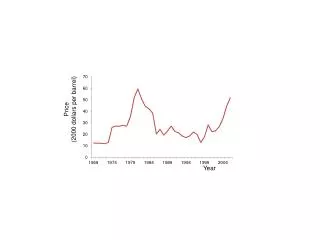
Historical Trends in Oil Prices & Production Quantity Analysis
290 likes | 402 Vues
Explore the historical trends in oil prices and production quantity from 1969 to 2006, including changes in price per barrel and millions of barrels per day. Analyze consumption data and market dynamics over time.
Télécharger la présentation 
Historical Trends in Oil Prices & Production Quantity Analysis
An Image/Link below is provided (as is) to download presentation
Download Policy: Content on the Website is provided to you AS IS for your information and personal use and may not be sold / licensed / shared on other websites without getting consent from its author.
Content is provided to you AS IS for your information and personal use only.
Download presentation by click this link.
While downloading, if for some reason you are not able to download a presentation, the publisher may have deleted the file from their server.
During download, if you can't get a presentation, the file might be deleted by the publisher.
E N D
Presentation Transcript
Price (2000 dollars per barrel) Year
Quantity (millions of barrels per day) Year
Price 1981 2006 Price (2000 dollars per barrel) 1979 Quantity (millions of barrels per day) 1974 1978 1996 1973 1986 2001 1995 Quantity Year
1981 2006 1980 1979 1985 2004 1978 Price (2000 dollars per barrel) 1996 1986 1969 1995 Quantity (millions of barrels per day)
S2 Price S1 P2 P1 D Q2 Q1 Quantity


More Related