Download
1 / 44
440 likes | 531 Vues
Learn how to interpret graphs, find equations, and understand functions with this comprehensive guide covering graphing, circles, functions, and more.

E N D
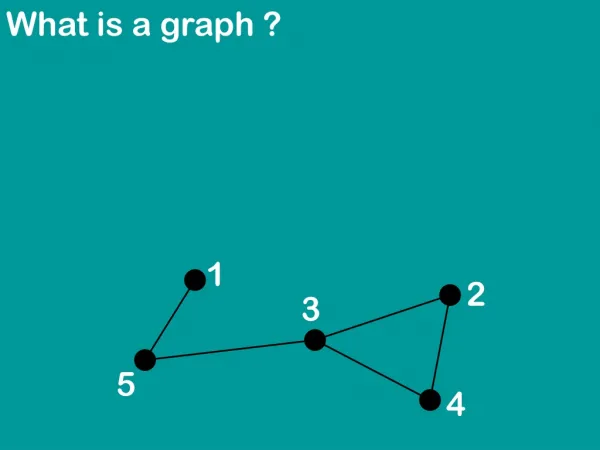
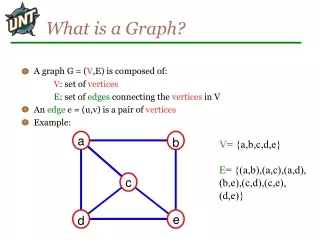
A graph is a diagram of a relationship of (at least) two variables with changing values.
The current value of each variable is represented as a distance from the origin.
The coordination of the variables is represented as a point on the graph
The equation of a graph • The algebraic relationship between variables on a graph • The equation is test: If you pick a pair of values that makes the equation true, that point is on the graph. If you pick a pair that is not true, the point is not on the graph. • Graphing is finding all the points that make the equation true, and changing their color.
Distance Formula • The distance between (a,b) and (x,y) is
Circle • A circle is the set of all points a given distance (the radius) from a given point (the center).
All points 4 units away from (1,2) For any point (x,y) The distance between (1,2) and (x,y) is 4 Using the Pythagorean Theorem… Is the equation of the circle
Equation of a circle • For radius r and center (a,b)
Consider a circle with equation x2 + (y+4)2 = 289. The center and radius are given by: • (0,4), radius=289 • (0,-4), radius=289 • (4,0), radius=289 • (-4,0), radius=289 • None of the above.
Consider a circle with equation x2 + (y+4)2 = 289. The center and radius are given by: E
Midpoint formula • The point halfway between (a,b) and (x,y) is
A function is a relationship between two changing variables • An “input” variable • An “output” variable • The result of “doing” the function to the output variable • Both variables change so that the “input” variable always tells you exactly what the “output” variable is. • You never get two outputs for the same input.
Function Output Any time I know the input, that’s enough information to tell me the output. Example: when input is 2, output is 20. input
Not a Function Input Just knowing the input is not enough to tell me the output Example: when input is 20, the output could be 2, 3.6, or 6.9. Output
Function output input
Not a Function output input
Function notation • For a function named ƒ • And an input variable named x • The output variable is named ƒ(x). • ƒ(x) is the number that is the result of doing the action ƒ to the number x
WARNING • ƒ(x) DOES NOT MEAN ƒ*x • You can only multiply numbers. f is NOT a number. f is the name of a relationship. • x and ƒ(x) are the numbers. • Brangelina is not a person. • Brangelina is the name of a relationship • Brad and Angelina are the people
How to do a function to the input number • Algebra: Substitute
How to do a function to the input number ƒ(x) ƒ x Find your input value on the x axis. Here the input value is 5.5
How to do a function to the input number ƒ(x) ƒ x Go up and over to Find your output value on the ƒ(x) axis. Here the output value is 25
How to do a function to the input number ƒ(x) ƒ x Input 5.5, output 25, name of function ƒ. ƒ(5.5)=25.
Given the function f(x)=x2 -2Mx, where M is some parameter, find f(3). • 3 • 3M • 9-6M • 6-9M • None of the above.
Given the function f(x)=x2 -2Mx, where M is some parameter, find f(3). C
Domain and Range • Function is a relationship between a changing input variable and a changing output variable. • The domain is a description of all the values that the changing input variable takes on. • The range is a description of all the value that the changing output variable takes on.
Example ƒ(x) Domain: [0,9] Range: [0,30] ƒ x
State the range of the function whose graph is pictured here. Select the best answer! A) B) C) D) E) None of the above
State the range of the function whose graph is pictured here. Select the best answer! D First, the output changes from -1 to -3 (excluding -1). The output can be any value between -3 and -1, but can’t be -1. Range: [-3,-1) Later, the output changes from 2 to 3. The output can be any value between 2 and 3, including 2 and 3. Additional Range: [2,3]