DART Project
DART Project. Communication Analytics January – April 2010. In this report:. Benchmarks/Trends Analytics by deliverable Recommendations. Baseline Survey & Web Analytics. December 2009 Communications Survey. Response Rates = 23% 42% Unit development 36% OUD 7% Financial 4% ITS

DART Project
E N D
Presentation Transcript
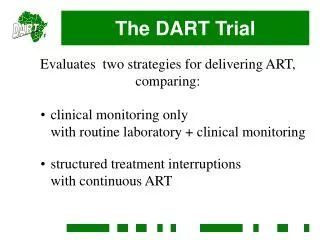
DART Project Communication Analytics January – April 2010
In this report: Benchmarks/Trends Analytics by deliverable Recommendations
Baseline Survey & Web Analytics December 2009 Communications Survey • Response Rates = 23% • 42% Unit development • 36% OUD • 7% Financial • 4% ITS • 11% Other Low financial response may reflect engagement and interest level by this community • DART Project Familiarity (scale of 1-10) • 15% - Very familiar (7-10) • 39% - Somewhat familiar (4-6) • 46% - Unfamiliar (0-3) Correlation between unfamiliarity and perceived level of impact. DART Project Impact (scale of 1-10) 62% - low level of impact on their work at this time. High level view of site activity over the last 16 months Traffic driven from targeted emails, so most people land on a particular announcement or article, then “bounce” out of the site.
Development and finance Communities’ exposure to the DART project Comparing years: 60% increase in site activity. Approximately *20-50% of the development and finance communities have seen DART base product *Fluctuates when counting unique views as individual staff Calculations based on latest In the Know list (667)
Gauging confidence levels Confidence at the broad community level appeared high in December. Confidence levels dip slightly when we look at smaller groups viewing the ‘vanilla’ product. This could be seen as the “reality effect” for folks. We expect confidence to fluctuate – particularly through change management. Data from future demos will help us identify trends of low confidence to better address concerns.
Major Communication Deliverables Analytics on Newsletter & Demonstrations
Delivered Communications • Project Update Email • Change Management Planning & DCC • Newsletter Issue 1 • Newsletter Issue 2 • Newsletter Issue 3 • Newsletter Issue 4 • Previews (6) July 09 Sept 09 Dec 09 Jan 10 Feb 10 March 10 April 10 • Dev • Council • Baseline • Survey • Med Demo • Recorded Demo • LSA Demo • Dev • Council • Canned Updates • Dev • Council • Dev • Council • Program Managers Demo Online communications Live Demonstrations Live Project Updates Vision & Change Management
Live Project Updates • Development Council Presentations • Every 6-8 weeks • Emphasis on ‘new’ and ‘fresh’ material • Rotate presenters (not always the Project Manager) Over time, we’ve tweaked presentation content based on informal qualitative feedback Chrissi receives and shares. • Canned Updates • Given to project and design team members • Enables members to easily share information with colleagues • Promotes consistent messaging across units • Package of communication materials includes: • PowerPoint slides • 30 second key message • Links to the latest newsletter • Recent additions to the FAQ The March update was accessed 63 times.
DART Newsletter • DART email list includes over 200 Finance + ITS contacts – so clickthrough rates reflect a broad audience • Industry average for emails of this size: 7%* • Tweaks to content, based on baseline survey results, are having a positive impact • “Plugging” the newsletter in “In the Know” boosts visibility.
Recorded Demonstration The online demo is one of our most popular posts. It’s an efficient way to share functionality. However, real data cannot be used in recordings. “Fake” data must be used for security purposes. • Follow-up Survey Results: • 76% interested in seeing another demo • 93% Length of each module was just right • 100% Presentation content easy to understand • 97% thought presentation content was Good • 86% would recommend to a colleague
DART Previews Less efficient in reaching many. However, real data can be used. Confidence levels can falter as people see incomplete views of the product. Most people had questions about “how to do X in DART” or “how will DART do X” • Product functionality feedback themes: • Capturing information • Default views (e.g. for education) • Interface (e.g. pop-out windows) • Integration with social media, productivity tools, and financial system • Reporting 31% reported low confidence in base product with no customizations. • Positive feedback themes: • User-friendly • Interface design and integration • Records relationship and data management • Business Process feedback themes: • Strategy on access/permissions • Data input and clean-up • Support at launch and beyond
Communications Strategy Overview: Integrates and supports the Change Management Approach • Build Awareness • Start gaining buy-in • Identify areas of potential resistance • Prepare for change • Educate + train • Address areas of resistance • Stabilize • Listen and respond to problems • Maintain bi-directional communication Spring/Summer 2010 Fall 2010 Fall 2011
Things to Continue: • Plugging the newsletter in “In the Know” • Face to face communications • Dev Council • Program Managers • Gift Officers • Directors • Schools, Colleges, and Units • Creating sharable key messages • “Canned update” for design team members to use when giving updates to their unit staff • Recorded Demonstrations • Efficient way to reach many • Positively received
Things to Change/Do • Don’t Presume info in the Newsletter is “old news” • Not everyone is reading it • It’s okay to re-use content in live updates, e.g. Dev Council • Improve communications data • Insert questions in Dev Council survey • Create and disseminate a survey through canned updates with design team members • Start the Unit Liaison Program