
Easy Map
E N D
Presentation Transcript
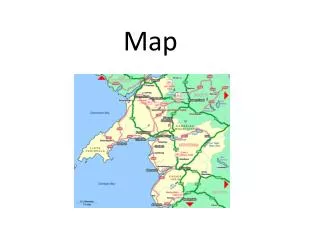
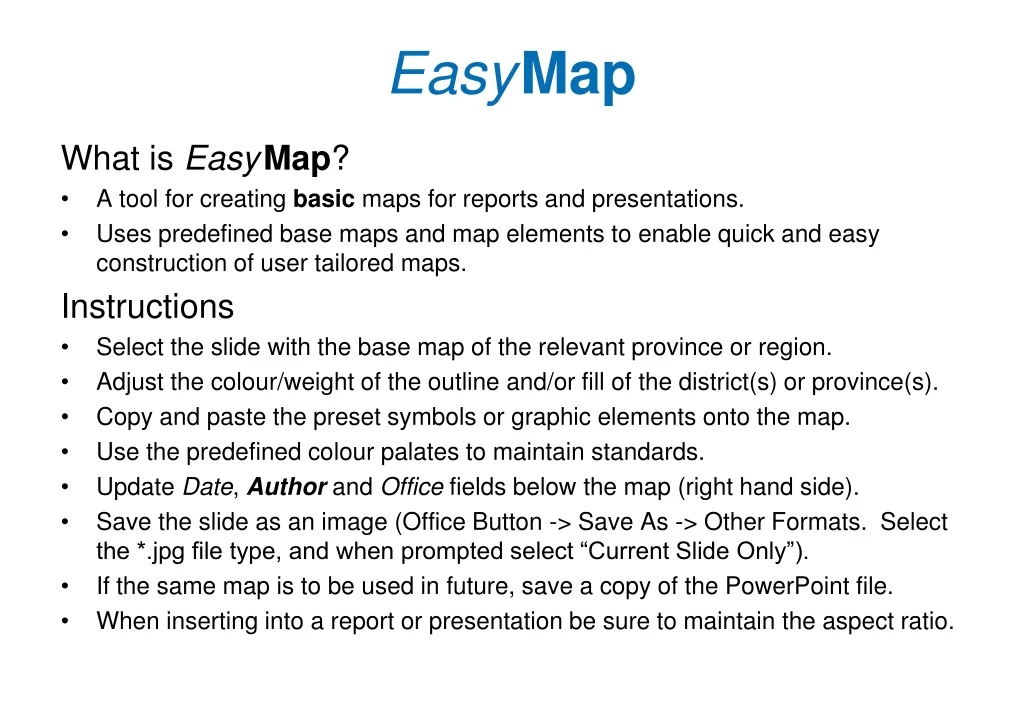
EasyMap What is EasyMap? • A tool for creating basic maps for reports and presentations. • Uses predefined base maps and map elements to enable quick and easy construction of user tailored maps. Instructions • Select the slide with the base map of the relevant province or region. • Adjust the colour/weight of the outline and/or fill of the district(s) or province(s). • Copy and paste the preset symbols or graphic elements onto the map. • Use the predefined colour palates to maintain standards. • Update Date, Authorand Office fields below the map (right hand side). • Save the slide as an image (Office Button -> Save As -> Other Formats. Select the *.jpg file type, and when prompted select “Current Slide Only”). • If the same map is to be used in future, save a copy of the PowerPoint file. • When inserting into a report or presentation be sure to maintain the aspect ratio.
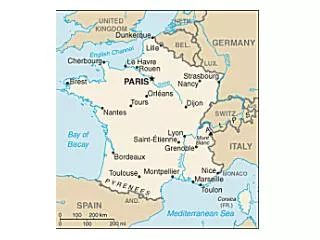
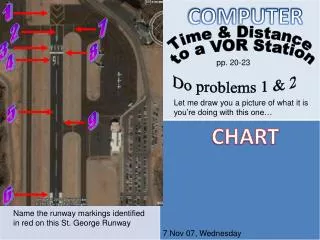
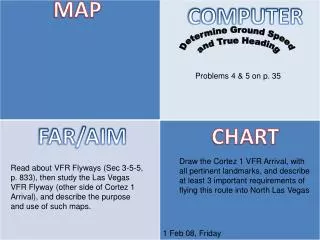
Data Source: SIMLAND Department of Map Disclaimer: The boundaries and names shown and the designations used on this map are not real, Simland is not real. This map is absolutely not, in anyway, an official endorsement by the United Nations. Creation date:
Data Source: SIMLAND Department of Map Disclaimer: The boundaries and names shown and the designations used on this map are not real, Simland is not real. This map is absolutely not, in anyway, an official endorsement by the United Nations. Creation date:
OCHA Symbol Catalogue • Cluster / Sector • Disasters • Affected Population • Damage • General Infrastructure • Health Facilities • Camp • Security • Physical Closure • Armed Troop • Mine / UXO Presence • Water and Sanitation • Relief Materials • Telecommunication
1. a) CLUSTER / SECTOR (B&W) Emergency Telecommunications Agriculture Protection Camp Coordination/ Management Water Sanitation Hygiene Early Recovery Food Security Education Coordination Emergency Shelter Agriculture Camp Coordination/Management Health Coordination Early Recovery Education Logistics Emergency Telecommunications Food Health Logistics Protection Nutrition Shelter and Non-Food Items Water and Sanitation
b) CLUSTER / SECTOR (COLOUR) Agriculture Logistics CCCM & NFI Nutrition Early Recovery Protection Education Child Protection Emergency Telecoms Gender Based Violence Food Shelter Health Water Non-food items Information Management
2. DISASTERS Cold Wave Insect Infestation Heat Wave Landslide/ Mudslide Cyclone, Hurricane, Typhoon Volcanic Eruption Drought Snow Avalanche Earthquake Storm Epidemic Storm Surge Fire Tornado Flood Flash Flood Tsunami
3. AFFECTED POPULATION Affected Population Missing Dead Injured Children
4. DAMAGE Damage Affected Partially Destroyed Destroyed
5. GENERAL INFRASTRUCTURE Airport Civil Infrastructure Airport Military Helipad Church Government Office Mosque Community Building Hindu Temple Buddhism Temple Police Station Seaport Tunnel Road Bridge School Airport Food Warehouse/ Storage
6. HEALTH FACILITIES Health Facilities Hospital Clinic Health Post Psychological Support
7. CAMP Temporary IDP/Refugee Camp Fixed Transition Sites Refugee Registration
8. SECURITY Hijacking Arrest/ Detention/ Abduction Murder Security Assault Robbery Attack Threat Forced Entry/ Office Occupation Harassment and Intimidation
9. PHYSICAL CLOSURE Physical Closure Trench Checkpoint Military Gate Road Gate Cross Border Observation Tower Earth Mound Road Block Road Barrier
11. MINE / UXO Presence Mine/ UXO Presence UXO spots Dangerous Areas Mined Areas
12. WATER AND SANITATION Water Sources Tap stand Well Potable Water Source Borehole Spring Water Submersible Pump Latrine
13. RELIEF MATERIALS Blanket Mosquito Net Non Food Item Bucket/ Jerry Can Clothing Plastic Sheeting Food Relief Goods Kitchen Sets Stove Tarpaulin Mattress Tent Medicine Bottle of Water Medical Supply
14. TELECOMMUNICATION Fax Radio Mobile Phone Internet
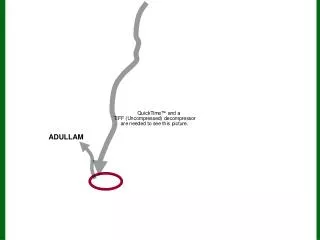
Insert your text and/ or symbols here Insert your text and/ or symbols here Insert your text and/ or symbols here Insert your text and/ or symbols here Insert your text and/ or symbols here Insert your text and/ or symbols here Map elements Try to keep the map as simple as possible. The angles of the lines and arrows should be 45 or 90 degrees. The colors you use should be in accordance with the OCHA Color Palette (see a few slides below). Alternatively or additionally to text explanations, you can insert photos, charts and diagrams. Arrows can help illustrate movements, e.g., population movements: Insert your text and/ or symbols here See the ‘Manual for Mapping in Microsoft PowerPoint’ for further and more detailed instructions (e.g., on how to insert pictures and on how to create graphics, charts and diagrams). Insert your text and/ or symbols here Insert your text and/ or symbols here
OCHA Color Palette Pantone 279 RGB 81/145/205 Pantone 229 RGB 122/0/60 Pantone 279 (50% opacity) RGB 164/190/227 Pantone 378 RGB 86/108/17 Reflex Blue RGB 0/85/164 Pantone Cool Gray 9 RGB 145/145/149 Pantone 660 RGB 5/108/182 Pantone Cool Gray 4 RGB 205/204/204
QGIS to Powerpoint QGIS ( https://qgis.org/en/site/ ) • Add vectors, create map • Create print composer – add map • Export as SVG Inkscape (https://inkscape.org/en/ ) • Open SVG • Save as .emf Powerpoint • Inset picture (.emf) • Right click on image (it might be black) – group – ungroup (twice) • Delete black image