Visualization Encoding
This text provides an introduction to data visualization, focusing on the encoding and presentation of information. It explores different data types, visualization tasks, and encoding techniques through various examples.

Visualization Encoding
E N D
Presentation Transcript
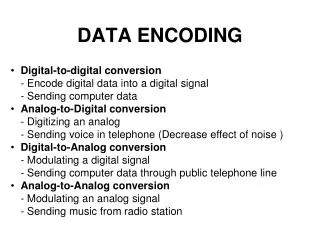
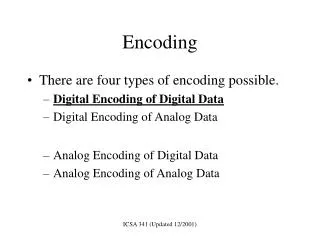
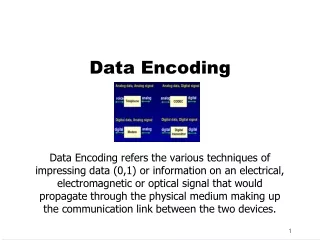
Introduction • Information visualization starts from data. • There are many forms that the data could take, text, spreadsheets, relational DB tuples, etc. • There are many patterns that the data could follow, clustering, outlier, correlation, etc. • Encoding: Application Domain Graphic Presentation Data
Fundamental Tasks • Information presentation. Maps, Photographs, Movies, … • Information extraction. Interactive graphical interface
Information Presentation Data Mining Example: Clustering
Information Extraction Data Mining Example: Clustering
Data Types • 1-D, 2-D, 3-D, temporal, multi-dimensional, tree and network data. • Data types characterize the information objects in the task domain.
Basic Visualization Tasks • Overview of a collection of data. • Zoom in/on objects of interest. • Filter out uninterested items. • Details-on-demand: view details. • Relate: View relationship. • History: Undo, Redo, Refinement. • Extract a subset of the data.
1-D Data and Task Encoding • Linear data: textual document, source code, etc. • User problems: count, find, replace, … • Encoding: fonts, color, size, layout, scrolling, selection capabilities, … • Product example: text editor, browser, …
2-D Data and Task Encoding • Planar or map data: geographical maps, floor plans, newspaper layouts, … • User problems: find adjacent items, search containment, find paths, filtering, details-on-demand, … • Encoding: size, color, layout, arrangement, multiple layers, … • Product example: CAD
3-D Data and Task Encoding • Real-world objects: building, human body • User problems: adjacency in 3-D, inside/outside relationship, position, orientation, occlusion • Encoding: overviews, landmarks, transparency, color, perspective, stereo display • Product example: CAD
Temporal Data and Task Encoding • Time series data: medical records, project management, historical presentation • User problems: finding all events before, after or during some time period or moment. • Encoding: time lines
Multi-dimensional Data and Task Encoding • Relational and statistical databases tuples. • User problem: finding patterns, clusters, correlations, gaps, outliers. • Challenge: • Simultaneously display many dimensions of large subsets of data. • Create displays that best encode the data pattern for a particular task. • Rapidly select a subset of tuples or dimensions.
Dimensionality Encoding • Multi-dimensional databases are structured as n-dimensional data cube. • The dimensions of the data can be explicitly encoded in the structure of tables.
Data Set Encoding • The data sources are encoded as layers. • The different result sets are encoded as different panes in different layers.
User Interest Encoding • Providing enough tools and allowing user to specify his interest. • The table configuration encodes the user interest. • Table configurations are defined in form of algebra • Concatenation • Cross product • Nest (Division)
For ordinal fields, algebra operand symbols take all domain values. • A = domain (A) = {a1, a2, …, an} • Example: Month = {Jan, Feb, …, Dec} • For quantitative fields, algebra operand symbols take the field names as values. • P = {P} • Example: Profit = {Profit} • Ordinal fields partition the table into rows and columns; quantitative fields are spatially encoded as axes within the panes.
Concatenation Example: • Quarter = {Qtr1, Qtr2, Qtr2, Qtr4} • Product = {Coffee, Espresso, Herbal, Tea} • Profit = {Profit}, Sales = {Sales} Ordinal Field Group By Quantitative Field Sorted By
Cross Product Example: • Ordinal x Ordinal • Ordinal x Quantitative
Nest (Division) Example: • Quantitative field does not make sense for divisions
Quarter x SumOfProfit Product x SumOfSales
Types of Graphics inside Panes • Types of Panes: • Ordinal – Ordinal • Ordinal – Quantitative • Quantitative - Quantitative
Visual Encoding • Shape • Size • Orientation • Color
Tree Type Data and Task Encoding • Exponential data: hierarchies, tree structures. • User problems: find the structural properties • Height of the tree • Number of children • Find nodes with same attributes • Encoding: • Outline style of indented labels
Node-link diagrams: allowing the encoding of linkage between entities. • Treemap: child rectangles inside parent rectangles • Product example: windows explorer, internet traffic, hyperbolic browser
Network Data and Task Encoding • Graph data: multiple paths, cycles, lattices • User problems: • Shortest path • Topology problems • Encoding: imperfect • Node-link diagram • Matrix
General Encoding Principles • Expressiveness: • Encode all the facts in the result set. • Encode only the facts in the result set. • Effectiveness: • Depends on the capability of the perceiver. • Encode the more important information more effectively.
Conclusion • Visualization helps • Information presentation • Information extraction • Good visual encoding should match the target data and user problems. • Studying the successful/unsuccessful visual encoding designs and techniques helps us to design and develop new encoding approaches.