Understanding State vs. Trait Constructs: Measurement, Norms, and Correlation in Research
This project explores the distinction between state and trait constructs, focusing on how tests measure these aspects. It evaluates criterion-referenced versus norm-referenced assessments, discussing the significance of established standards versus relative scores. We also identify appropriate norms for standardizing measures and the rationale behind these choices, alongside sampling methods like random and stratified. The discussion extends to correlation types, significance, and multiple regression analyses, emphasizing their application in predicting academic performance and understanding relationships among variables.

Understanding State vs. Trait Constructs: Measurement, Norms, and Correlation in Research
E N D
Presentation Transcript
State vs Trait Constructs
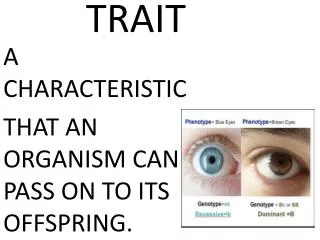
Project question 4 • Does your test measure a state or a trait?
Criterion vs Norm referenced • Criterion reference = compares to established standard, well defined objectives • Norm referenced = compares each score to other scores, relative
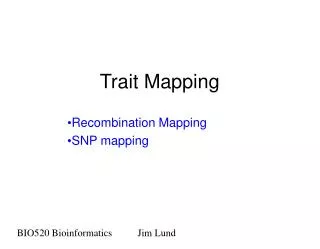
Norms • Types of norms?????
Project question 5 • What sort of norms would be appropriate to collect to standardize your measure? • Why did you select those norms?
Sampling • Random • Stratified • Purposive • Incidental/convenience
Correlations • NOT causal • relationship between variables • predictive
Correlation values -1 to +1 .56, -.45, -.09, .89, -.93
Appropriate Correlations 1 - data must be linear not curvilinear (determine by scatterplot)
Appropriate Correlation to use 1 – linear data 2 - type of scale interval (or ratio) = Pearson r ordinal = Spearman rho 3 - number of subjects more than 30 = Pearson fewer than 30 = Spearman
Decision Tree Linear No = no corr yes = corr Scale ordinal = rho interval = r number < 30 = rho > 30 = r
Project question #6 • Which correlation formula would you use when correlating the scores from your measure with another variable? • Why would you use that formula?
Multiple correlations • Correlations between more than one variable done at the same time.
Multiple regression • Relationship between more variables • Uses specific predictor and criterion variables • Looks at relationships between predictors • Can factor out partial relationships
Multiple regression - example • Grad school grade performance = criterion (or outcome) • Predictor variables = undergrad GPA = GRE scores = Quality of statement of purpose
Multiple regression data PredictorBeta (=r)significance (p) GPA .80 .01 GRE .55 .05 statement.20.20
Multiple regression – example 2 • Predictor variables = Metacognition, Locus of Control, Learning Style • Criterion variable = academic performance (grade)
Multiple regression data PredictorBeta (=r)significance (p) Meta. .75 .01 LofC .65 .05 L.S. .32 .15