Download
1 / 1
10 likes | 94 Vues
2.0. 20. +2. +1. 1.8. 10. 10. 1.6. 0.4. 15. 1.4. 1.2. 0.3. 1.0. 10. 0.8. 0.2. 0.6. 0.4. 0.1. -3. 0. -1. -2. 5. 10. 10. 10. 10. 0.2. 0. 0. +1.0. -1.0 . -0.5. -1.0 . -0.5. 0. +0.5. 0. +0.5. +1.0. 0. -1.0. -0.5. 0. +1.0. +0.5. Frequency (Hz). +5. +4.

E N D
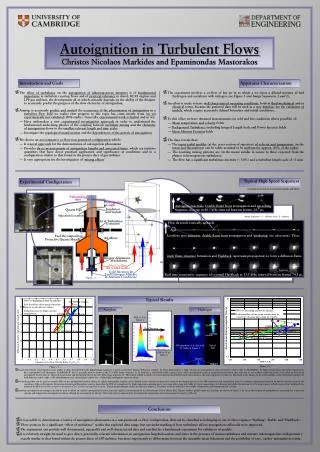
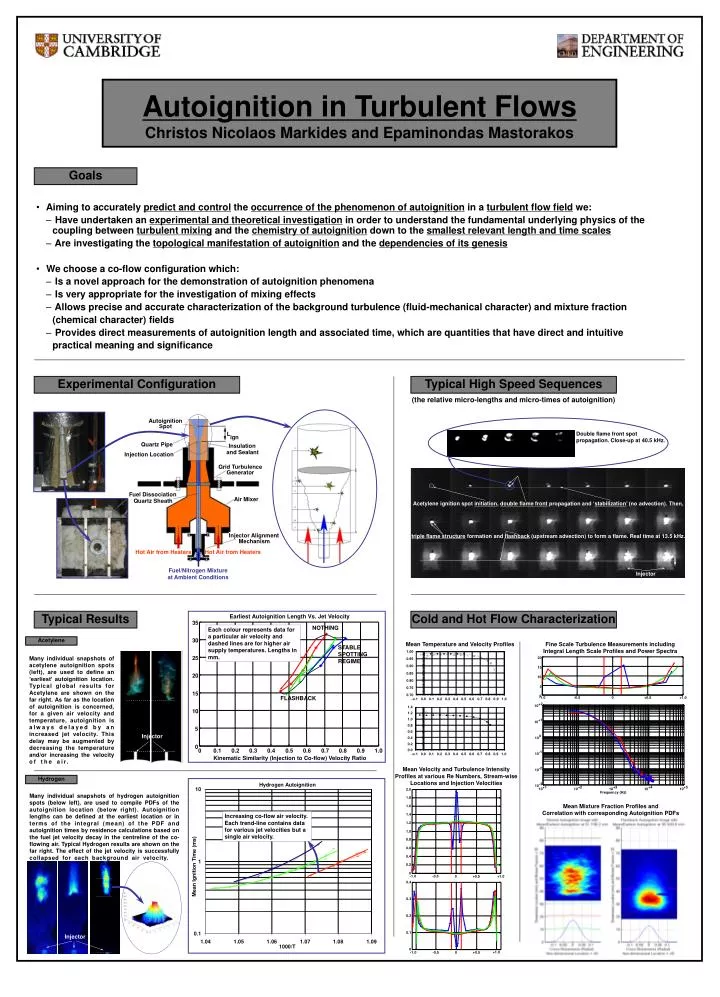
2.0 20 +2 +1 1.8 10 10 1.6 0.4 15 1.4 1.2 0.3 1.0 10 0.8 0.2 0.6 0.4 0.1 -3 0 -1 -2 5 10 10 10 10 0.2 0 0 +1.0 -1.0 -0.5 -1.0 -0.5 0 +0.5 0 +0.5 +1.0 0 -1.0 -0.5 0 +1.0 +0.5 Frequency (Hz) +5 +4 +3 +2 +1 10 10 10 10 10 Autoignition Spot Double flame front spot propagation. Close-up at 40.5 kHz. L ign Quartz Pipe Insulation and Sealant Injection Location Grid Turbulence Generator Fuel Dissociation Air Mixer Quartz Sheath Acetylene ignition spot initiation, double flame front propagation and ‘stabilization’ (no advection). Then, triple flame structure formation and flashback (upstream advection) to form a flame. Real time at 13.5 kHz. Injector Alignment Mechanism Hot Air from Heaters Hot Air from Heaters Fuel/Nitrogen Mixture at Ambient Conditions Injector Earliest Autoignition Length Vs. Jet Velocity 35 NOTHING Each colour represents data for a particular air velocity and dashed lines are for higher air supply temperatures. Lengths in mm. 30 1.00 o 0.95 o 0.90 o 0.85 o 0.80 o 0.75 o 0.70 STABLE SPOTTING REGIME 25 20 -0.1 0.0 0.1 0.2 0.3 0.4 0.5 0.6 0.7 0.8 0.9 1.0 o 15 FLASHBACK 1.4 o 1.2 o 1.0 o 0.8 o 0.6 o 0.4 o 0.2 o 0.0 10 5 Injector 0 -0.1 0.0 0.1 0.2 0.3 0.4 0.5 0.6 0.7 0.8 0.9 1.0 o 0 0.1 0.2 0.3 0.4 0.5 0.6 0.7 0.8 0.9 1.0 Kinematic Similarity (Injection to Co-flow) Velocity Ratio Increasing co-flow air velocity. Each trend-line contains data for various jet velocities but a single air velocity. Autoignition in Turbulent FlowsChristos Nicolaos Markides and Epaminondas Mastorakos Goals • Aiming to accurately predict and control the occurrence of the phenomenon of autoignition in a turbulent flow field we: • Have undertaken an experimental and theoretical investigation in order to understand the fundamental underlying physics of the coupling between turbulent mixing and the chemistry of autoignition down to the smallest relevant length and time scales • Are investigating the topological manifestation of autoignition and the dependencies of its genesis • We choose a co-flow configuration which: • Is a novel approach for the demonstration of autoignition phenomena • Is very appropriate for the investigation of mixing effects • Allows precise and accurate characterization of the background turbulence (fluid-mechanical character) and mixture fraction (chemical character) fields • Provides direct measurements of autoignition length and associated time, which are quantities that have direct and intuitive practical meaning and significance Experimental Configuration Typical High Speed Sequences (the relative micro-lengths and micro-times of autoignition) Typical Results Cold and Hot Flow Characterization Acetylene Fine Scale Turbulence Measurements including Integral Length Scale Profiles and Power Spectra Mean Temperature and Velocity Profiles Many individual snapshots of acetylene autoignition spots (left), are used to define an ‘earliest’ autoignition location. Typical global results for Acetylene are shown on the far right. As far as the location of autoignition is concerned, for a given air velocity and temperature, autoignition is always delayed by an increased jet velocity. This delay may be augmented by decreasing the temperature and/or increasing the velocity of the air. ooooooooo Mean Velocity and Turbulence Intensity Profiles at various Re Numbers, Stream-wise Locations and Injection Velocities Hydrogen Many individual snapshots of hydrogen autoignition spots (below left), are used to compile PDFs of the autoignition location (below right). Autoignition lengths can be defined at the earliest location or in terms of the integral (mean) of the PDF and autoignition times by residence calculations based on the fuel jet velocity decay in the centreline of the co-flowing air. Typical Hydrogen results are shown on the far right. The effect of the jet velocity is successfully collapsed for each background air velocity. oo Mean Mixture Fraction Profiles and Correlation with corresponding Autoignition PDFs Injector