Download

1 / 5
50 likes | 64 Vues
Comparison of Hg EDS and WDS Analysis on Commercial Plastic Material. By John J. Donovan University of Oregon, Department of Chemistry. EDS Analysis. 100 sec counting time (no visible peak). EDS Analysis (cont’d). 500 sec counting time (no visible peak). EDS Analysis (cont’d).

E N D
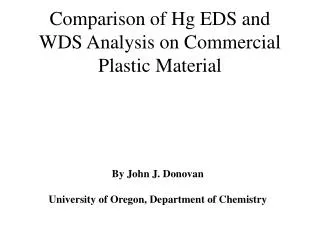
Comparison of Hg EDS and WDS Analysis on Commercial Plastic Material By John J. Donovan University of Oregon, Department of Chemistry
EDS Analysis 100 sec counting time (no visible peak)
EDS Analysis (cont’d) 500 sec counting time (no visible peak)
EDS Analysis (cont’d) 1000 sec counting time, with Be window inserted (barely visible peak)
WDS Analysis TakeOff = 40.0 KiloVolt = 20.0 Beam Current = 52.0 Beam Size = 0 Un 6 std-flex Results in Elemental Weight Percents ELEM: Hg Pb Cr TIME: 240.00 240.00 240.00 AVER: .09916 -.03815 -.00240 SDEV: .07870 .06759 .00271 Detection limit at 99 % Confidence ELEM: Hg Pb Cr AVER: .00485 .00551 .00280 990 PPM of Hg easily detected, with 40 PPM sensitivity 240 sec counting time