Download
1 / 10
100 likes | 254 Vues
ETFs & Morningstar. Fall 2012. www.morningstar.com. . . . . . Last Price : the last price the ETF sold for 52-Week Range : highest and lowest closing prices in the last 52 weeks Total Assets : total value of investments in the fund

E N D
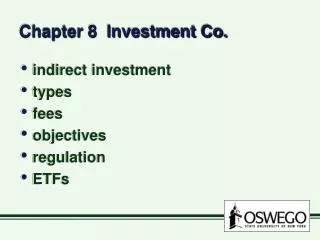
ETFs & Morningstar Fall 2012
• Last Price: the last price the ETF sold for • 52-Week Range: highest and lowest closing prices in the last 52 weeks • Total Assets: total value of investments in the fund • Expenses: the percent of total assets taken for fees annually • Volume: number of shares traded that day • Avg. Volume: average number of shares traded per day • Bid/Ask/Spread: buying price/ selling price/ % difference • Category: Morningstar Box • Prem/Discount: how much above or below net asset value (NAV) the ETF is trading • 12-Mo. Yield: distributions (like dividends) / [NVA + Capital Gains]