Download

1 / 44
440 likes | 612 Vues
What Is Demand?. Ch. 4. Demand. Demand- The willingness to buy a good or service and the ability to pay for it. We have many wants, big house, car, expensive clothes, but we can’t always afford them. When we can’t afford them we have no actual demand

E N D
What Is Demand? Ch. 4
Demand • Demand- The willingness to buy a good or service and the ability to pay for it. • We have many wants, big house, car, expensive clothes, but we can’t always afford them. • When we can’t afford them we have no actual demand • Actual Demand- having the desire and ability to pay for a good or service
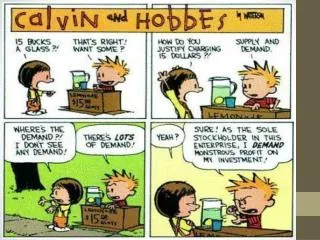
Price Always Plays A Role In Demand • Law of Demand- When prices go down, consumer demand usually rises. When prices go up demand usually goes down. • Ex. PS3 costs $400.00 and their sales are down compared to XBOX 360 which costs $299.00. Sony is trying to compete with Microsoft by cutting prices
How does the law of demand apply to the game console wars between Sony, Microsoft, and Nintendo?
Displaying The Law of Demand • Demand Schedule- Shows how much of a good or service an individual/consumer is willing and able to purchase at each price in a market. Used by individual • Market Demand Schedule- Lists how much of an item all consumers are wiling to purchase at each price. Used by businesses to set prices • Demand schedules show individuals and Market schedules show groups
Why do markets behave the same way as individuals? • Ans- Because markets are made up of individual consumers.
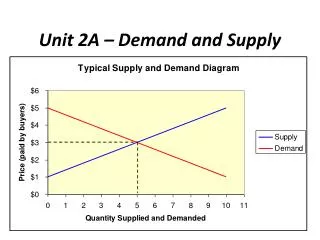
Refer to Text pg 102-103 • Demand Curve- graphically shows data from a demand schedule • Market Demand Curve- graphically shows data from Market Demand Schedule.
Sect. 2 What Factors Affect Demand? • What influences you when you decide to buy a good or service? • Why do you think the demand schedule curve slopes downwards? • What influences you when purchasing goods and services?
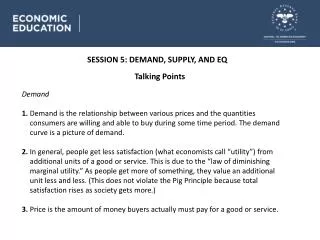
Diminishing Marginal Utility • States the marginal benefit of using one more unit of a product each time drops as we use more. • Refresher, Utility is the benefit we get from using a good or service.
Example • You are hungry and decide to go to Arby’s. You would normally buy one meal to satisfy your hunger. Each additional meal you buy will lead to less personal benefit and a sick stomach.
Example Continued • Because you receive less satisfaction from purchasing more than one meal the consumer expects the price to drop as well. Hence, the 5 for $5 Dollar Deal at Arby’s
This creates the downward slope on the demand curve which we call diminishing marginal utility • Refer to chart on page 107
Two patterns cause consumers to buy less at higher prices • Income Effect- change in the amount a person will buy because the purchasing power of their income changes • Ex. You want to buy a video game. One is $30 and the other game costs $50. Buying the $30 game makes you feel twenty bucks richer. If the overall price of all games would rise to $50, you would buy less games.
Substitution Effect- a change in the amount that consumers will buy because they buy the substitute product instead. • Ex. Post Raisin Bran and Great Value Raisin Bran.
Example • You go to the mall to buy an $80 pair of shoes. You find a pair of shoes on sale for $55 dollars. • You substitute similar good for a cheaper version • Give a real world of example of how the substitution effect causes consumers to buy less at higher prices
Change In Quantity Demanded • This is where the amount demanded by the consumer either increases or decreases with price • Refer to chart on page 108 • How would a demand curve on a demand schedule and market schedule differ? • Ans. Market takes into consideration larger quantities due to looking at the whole market
6 Factors That Change Demand • Change in demand occurs when something prompts consumers to buy different amounts at every price • Factor 1- Income- when a person’s income goes up or down the amount of purchases will go up or down • Make less $ demand less
Most times the more you make the demand goes up. Goods that fall into this category are normal goods • Normal Goods- goods consumers demand more when income rises • Some goods the demand decreases when income rises • Inferior Goods- goods you want less of when income rises
Example of Inferior Goods • Before pay raise you rented an apartment. With your new job and a higher salary you decide to buy a home.
Factor 2 Market Size • Deals with the number of consumers within a market • Ex. A college town- during school months the market for restaurants and fast food increases. During the summer months demand changes due to students going home for the summer.
Pop. Shifts or migration can effect market size and demand • Ex. Beaver Counties population in 1970 was 208,418 and in 2006 was 177,736 • With the collapse of the steel industry came a drastic drop in pop. This has led to a smaller market place in the county • Decrease in pop.= less demand for goods and services
Factor 3 Consumer Tastes • If a good or service is popular, people buy it at any price. Once it loses popularity price goes down. • What could influence a rise in consumer popularity? • Advertising pays a key role in this factor. Advertisers are looking to create demand for a product
Factor 4 Consumer Expectations • Do you think the best price to buy a good or service is now or in the future? If its in the future, you may wait to buy the product. This causes a rise in demand at a later date. • Ex. I-Phone- A couple of years from now the demand will increase and prices will drop
Example • Cars are usually cheaper in the summer because dealerships are trying to make room on the lot for the newer models that arrive in the fall.
Factor 5 Substitutes • These are goods and services that can be used in place of each other. They are interchangeable. • Ex. Price of gas is over $3 a gallon. You decide to take public transportation instead of driving. Demand for public transportation goes up and personal consumption of gas goes down
You are substituting public transit for your own car • Demand for the substitute increases= drops in demand for the original • Heating Oil price increases, which may lead to people substituting a wood burner for a oil furnace
Factor 6 Complements • When the use of one product increases, an accessory or accompanying product of the original increases • Ex. DVD Players and DVDS • Ex. HD TVs and HD cable service
Section 3 What is Elasticity of Demand? • Price and Demand go hand and hand • Price, consumer buying habit, and the importance of the good or service play a key role in demand. • Price increase does not always change demand • Consumers respond to price change and we measure this with elasticity of demand
Elasticity of Demand • It measures how responsive consumers are to price change. How flexible will their wallets and buying habits be? • Ex. Elastic Band • Demand can be elastic or inelastic
Elastic Demand • Demand is elastic when price change of a good or service drives demand way up or way down • Ex. If the price of a Dell Computer drops by 10% and demand increases by 20%, this means this good is elastic. • When price rises 10% people decide to buy a substitute product. An HP computer • Products that have lots of substitutes are usually elastic
Inelastic Demand • If quantity demanded changes little as price goes up or down. • Price has little impact on inelastic products. • Usually have few if any substitute products • Ex. Price of Milk
Overtime Elasticity of A Product Can Change • The more substitutes for the original the are made overtime, then the more elastic a product may become. • This can change price and demand. • Ex. Hybrid Cars- Right now there are not many options. In the future, there will be more substitute versions.
Refer to charts showing elastic and inelastic demand • Elastic curves bow • Inelastic curves show no change
Unit Elastic- when percentage change in price and demand are the same • Ex. Price rises 5% and quantity demand falls 5% • Unit Elastic is the middle ground between elastic and inelastic
3 Factors That Affect Elasticity of Demand • Factor 1- Substitute Goods or Services • The more options or substitutes you have for the consumer, the more elastic the good • The fewer substitutes, the more inelastic a good or service becomes
Factor 2 • Proportion of Income- the percentage of our income you spend on goods or services affects elasticity. • Ex. You spend 10% of your income on video games. Price of games rises, you buy less games. This leads to more elastic demand. You will look for other options or substitutes for that product
Example • You spend a smaller percentage of income on a Sunday paper. Price of the paper rises, but you still buy that paper. • There are few subs for that paper and it is a small percentage of your income spent. • This leads to a more inelastic demand. • Income Rises=Demand Up Income lowers=demand down
Factor 3 Necessities VS Luxuries • Necessities are inelastic. You need them and price rise does not matter. Food, water and shelter • You still have to buy them, but you may buy a little less. • Your change in demand will still be smaller than the price hike, so it remains inelastic
Luxuries you don’t need. • There are many substitutes for luxury items, which creates an elastic demand for those goods
Calculating Elasticity of Demand • Businesses calculate Elasticity of Demand to set prices for goods and services • Elastic Prices- businesses may cut prices to make more profit and create more demand. Ex. Faygo Pop vs Pepsi • Inelastic Prices- price cuts won’t help, you don’t have to worry about substitute goods or services
To determine Elasticity of Demand economists look to see if percentage in quantity demanded by consumers is greater than the percentage change in price
Formula- Elasticity of Demand STEP 1 Original Quantity- New Quantity Original Price X 100= = Percentage Change in Demand STEP 2 Original Price- New Price Percentage Change in Price X 100= = Percentage Change in Price
STEP3 %Change in Quantity % Change in Price = Elasticity If the final number is greater than 1, the demand is elastic. Less than 1, it is inelastic.
Economists calculate Total Revenue (money made selling a good or service) to measure elasticity • Price X Quantity Sold = Total Revenue • You can look at the results of revenue by plugging in different prices X quantity sold. • This is known as the Total Revenue Test