Download
1 / 1
10 likes | 120 Vues
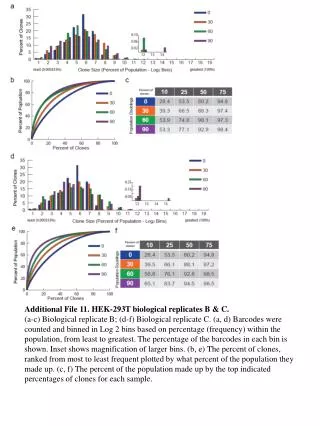
This study analyzes barcoded clones in HEK-293T biological replicates B and C. Barcodes were counted and categorized into Log2 bins based on their frequency percentage within the population, ranging from least to greatest. The distribution of barcodes across these bins is displayed, with an inset providing a magnified view of larger bins. Additionally, the percentage of clones is ranked from most to least frequent based on their contribution to the population. This analysis aids in understanding the diversity and frequency of barcoded clones in cell populations.

E N D
Additional File 11. HEK-293T biological replicates B & C. (a-c) Biological replicate B; (d-f) Biological replicate C. (a, d) Barcodes were counted and binned in Log 2 bins based on percentage (frequency) within the population, from least to greatest. The percentage of the barcodes in each bin is shown. Inset shows magnification of larger bins. (b, e) The percent of clones, ranked from most to least frequent plotted by what percent of the population they made up. (c, f) The percent of the population made up by the top indicated percentages of clones for each sample.