Download
1 / 26
260 likes | 362 Vues
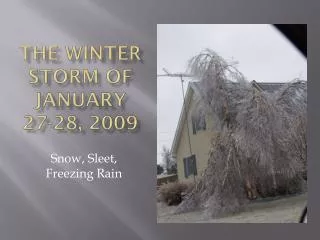
Mesoscale Features of the 31 January 2011 Oklahoma Storm. Jennifer Newman School of Meteorology, University of Oklahoma. Event Overview. From 31 January to 1 February 2011, regions of thunder-sleet, freezing rain, and snow moved through Oklahoma >100 car accidents Close to 500 motorists

E N D
Mesoscale Features of the 31 January 2011 Oklahoma Storm Jennifer Newman School of Meteorology, University of Oklahoma
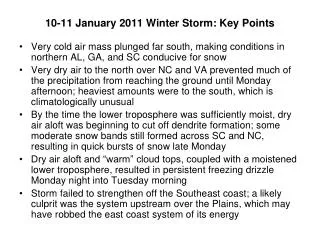
Event Overview From 31 January to 1 February 2011, regions of thunder-sleet, freezing rain, and snow moved through Oklahoma >100 car accidents Close to 500 motorists stranded 4 fatalities
Mesoscale Features Convective activity persisted in Oklahoma, despite the fact that the atmosphere was extremely stable CSI? Bands of snow formed in SW OK and moved through Oklahoma during the early morning of 1 February. Located ≈100 km apart Ducted gravity waves?
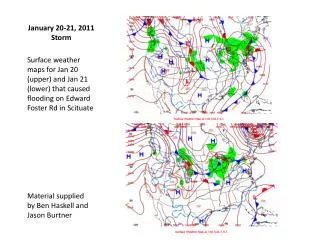
Evaluation for CSI Vertical cross-section was taken using soundings oriented along a SW-NE line. Soundings used: 00Z and 12Z 1 February 2011
CSI Cross-section: 00Z Purple lines: θe Blue lines: mg
CSI Cross-section: 00Z Purple lines: θe Blue lines: mg CSI possible
CSI Cross-section: 12Z Purple lines: θe Blue lines: mg
Background: Gravity Waves Waves are created when a boundary between materials of different densities is perturbed -Pressure oscillations -Shifts in wind speed and direction -Vertical motion can modulate or induce precipitation Reference: Bosart, L. F. and F. Sanders, 1986: Mesoscale structure in the Megalopolitan Snowstorm, 11–12 February 1983. Part III: A large-amplitude gravity wave. J. Atmos. Sci., 43, 924–939.
Background: Ducted Gravity Waves If a stable layer is located underneath a convectively unstable layer, gravity wave energy can be reflected and remain in the lower layer (Lindzen and Tung 1976) Reference: Lindzen, R. S. and K.-K. Tung, 1976: Banded convective activity and ducted gravity waves. Mon. Wea. Rev., 104, 1602–1617.
Mesonet Observations of Gravity Wave Observed at all stations enclosed in red circles Data from stations in blue circles shown on next slide
Mesonet Data: Pressure Oscillations Sea-Level Pressure Time Series Pressure drop of ≈ 2-3 mb in approx. 40 minutes Phase speed: 28.9 m s-1 Wavelength: 200 km
Ninnekah Mesonet Station Sea-Level Pressure and 10-m Wind Time Series
KTLX Radar: 1200 UTC 0.5° Reflectivity
KTLX Radar: 1230 UTC 0.5° Reflectivity
KTLX Radar: 1300 UTC 0.5° Reflectivity
KTLX Radar: 1330 UTC 0.5° Reflectivity
KTLX Radar: 1400 UTC 0.5° Reflectivity
Mesonet vs. Radar Observations • Lowest pressure occurred just ahead of precip. band (area of rising motion) • From conceptual model: Greatest rising motion should occur halfway between pressure ridge and trough • Possible that speed of precip. bands was different than phase speed of gravity wave • Wavelength of gravity wave based on pressure fluctuations was different than wavelength of precip. bands also suggests propagation speeds were different
Phase Speed Calculations Reference: Lindzen, R. S. and K.-K. Tung, 1976: Banded convective activity and ducted gravity waves. Mon. Wea. Rev., 104, 1602–1617.
Phase Speed Calculations Unstable layer Stable layer
Phase Speed Calculations Unstable layer Stable layer
Summary and Conclusions • Several mesoscale features were evident from radar and satellite imagery during the Oklahoma storm of 31 January – 1 February 2011 • Based on observed soundings, CSI was possible at low levels over Norman at 00Z 1 February • - There were likely other processes occurring (frontogenesis, vorticity advection) that enhanced convection • - Difficult to isolate effects of CSI • Snow bands on 1 February appear to be associated with a gravity wave, which was observed at the surface in great detail • Theoretical gravity wave phase speed agrees well with timing of pressure oscillations