Comprehensive Lipid and Genetics Profile for Cardiovascular Risk Assessment
170 likes | 210 Vues
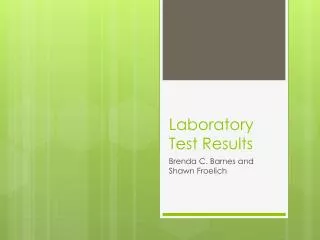
This detailed profile includes lipid levels, genetic variants, and cardiovascular risk markers to assess heart health. Get insights on cholesterol, lipoproteins, inflammatory markers, and genetic predispositions.

Comprehensive Lipid and Genetics Profile for Cardiovascular Risk Assessment
E N D
Presentation Transcript
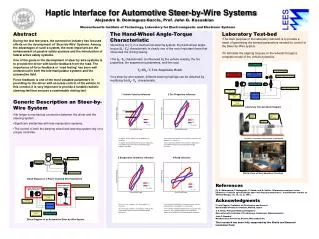
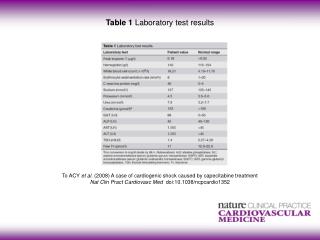
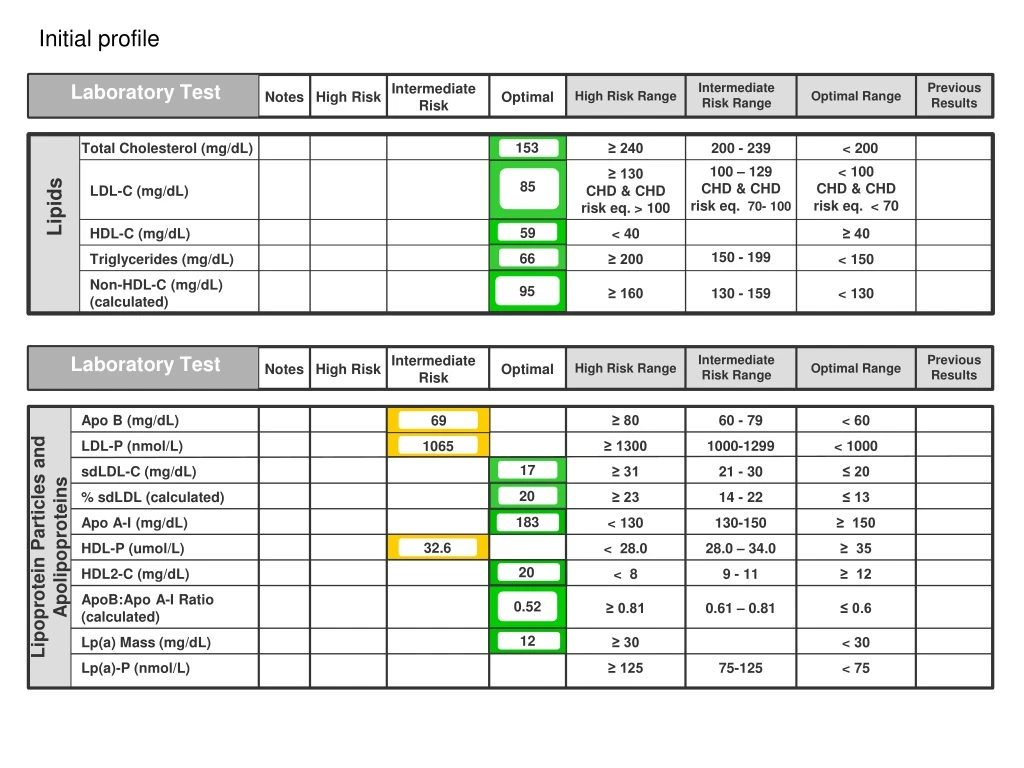
Initial profile 153 Total Cholesterol (mg/dL) ≥ 240 200 - 239 < 200 100 – 129 CHD & CHD risk eq. 70- 100 < 100 CHD & CHD risk eq. < 70 ≥ 130 CHD & CHD risk eq. > 100 85 LDL-C (mg/dL) Lipids 59 HDL-C (mg/dL) < 40 ≥ 40 150 - 199 66 Triglycerides (mg/dL) ≥ 200 < 150 Apo B (mg/dL) ≥ 80 60 - 79 < 60 69 Laboratory Test Laboratory Test Non-HDL-C (mg/dL) (calculated) Intermediate Risk Intermediate Risk Intermediate Risk Range Intermediate Risk Range Previous Results Previous Results LDL-P (nmol/L) ≥ 1300 1000-1299 < 1000 1065 95 Notes Notes High Risk High Risk Optimal Optimal High Risk Range High Risk Range Optimal Range Optimal Range ≥ 160 130 - 159 < 130 17 sdLDL-C (mg/dL) ≥ 31 21 - 30 ≤ 20 20 % sdLDL (calculated) ≥ 23 14 - 22 ≤ 13 183 Apo A-I (mg/dL) < 130 130-150 ≥ 150 Lipoprotein Particles and Apolipoproteins 32.6 HDL-P (umol/L) < 28.0 28.0 – 34.0 ≥ 35 20 HDL2-C (mg/dL) < 8 9 - 11 ≥ 12 ApoB:Apo A-I Ratio (calculated) 0.52 ≥ 0.81 0.61 – 0.81 ≤ 0.6 12 Lp(a) Mass (mg/dL) ≥ 30 < 30 Lp(a)-P (nmol/L) ≥ 125 75-125 < 75
Estimated Genotype frequency2/2 (~1-2%), 2/3 (~15%), 2/3 (1-2%), 3/3 (~55%), 3/4 (~ 25%), 4/4 (~1–2%) Apolipoprotein E (T471C, C609T)^ rs429358, rs7412 Lipoprotein Genetics 3/3 CYP2C19*2*3^ rs4244285, rs498693 *1*1 = optimal, *1/*2 or *1/*3 = intermediate, *2/*2, *2/*3 or *3/*3 = poor *1/*1 Platelet Genetics CYP2C19*17^ rs12248560 Rapid metabolizers at increased risk for bleeding on Plavix Laboratory Test Laboratory Test Intermediate Risk Intermediate Risk Intermediate Risk Range Intermediate Risk Range Previous Results Previous Results *1*1 = optimal, *1/*17 = rapid, *17/*17 = ultra rapid Notes Notes High Risk High Risk Optimal Optimal High Risk Range High Risk Range Optimal Range Optimal Range *1/*17 Optimal = Non-carrier (Arg/Arg); At Risk (Arg/Gln or Gln/Gln) Factor V Leiden (G1691A)^ rs6025 Arg/Arg Prothrombin Mutation (G20210A)^ rs1799963 Optimal = Non-carrier (G/G); At Risk = (G/A or A/A) G/G Coagulation Genetics 173 Myeloperoxidase (mg/dL) > 350 223-350 < 223 C/T MTHFR (C677T)^ rs1801133 (Methylenetetrahydrofolate Reductase) Lp-PLA2 (ng/mL) 160 Estimated Genotype Frequency C/C (~49.3%), C/T (~39.8%), T/T (~10.9%) > 235 200 - 235 < 200 Inflammatory / Oxidation A/C hs-CRP (mg/L) <0.03 ≥ 3.0 1.0 – 2.9 < 1.0 Estimated Genotype Frequency C/C (~7-12%), A/C (~30%), A/A (~58-63%) MTHFR (A1298C)^ rs1801131 ) Fibrinogen (mg/dL) ≥ 465 391 - 464 ≤ 390 310
Follow up profile 164 153 Total Cholesterol (mg/dL) ≥ 240 200 - 239 < 200 100 – 129 CHD & CHD risk eq. 70- 100 < 100 CHD & CHD risk eq. < 70 ≥ 130 CHD & CHD risk eq. > 100 88 85 LDL-C (mg/dL) Lipids 64 59 HDL-C (mg/dL) < 40 ≥ 40 150 - 199 82 66 Triglycerides (mg/dL) ≥ 200 < 150 Non-HDL-C (mg/dL) (calculated) 100 95 ≥ 160 130 - 159 < 130 Apo B (mg/dL) ≥ 80 60 - 79 < 60 64 69 Laboratory Test Laboratory Test Intermediate Risk Intermediate Risk Intermediate Risk Range Intermediate Risk Range Previous Results Previous Results 1065 LDL-P (nmol/L) ≥ 1300 1000-1299 < 1000 1022 Notes Notes High Risk High Risk Optimal Optimal High Risk Range High Risk Range Optimal Range Optimal Range 16 17 sdLDL-C (mg/dL) ≥ 31 21 - 30 ≤ 20 18 20 % sdLDL (calculated) ≥ 23 14 - 22 ≤ 13 183 Apo A-I (mg/dL) < 130 130-150 ≥ 150 149 Lipoprotein Particles and Apolipoproteins 32.6 36.5 HDL-P (umol/L) < 28.0 28.0 – 34.0 ≥ 35 25 20 HDL2-C (mg/dL) < 8 9 - 11 ≥ 12 ApoB:Apo A-I Ratio (calculated) 0.52 0.43 ≥ 0.81 0.61 – 0.81 ≤ 0.6 12 10 Lp(a) Mass (mg/dL) ≥ 30 < 30 Lp(a)-P (nmol/L) ≥ 125 75-125 < 75
Glucose 102 > 125 100 - 125 70 - 99 5.8 HbA1c (%) ≥ 6.5 5.7 – 6.4 ≤ 5.6 Estimated Average Glucose (mg/dL) (calculated 119.8 ≥ 139.9 116.9 – 129.2 ≤ 116.8 Glycemic Control > 339 293 - 339 < 293 339 Fructosamine (µmol/L) GlycationGap -1.76 > 0.77 < 0.45 0.45 – 0.77 6.9 Postprandial Glucose Index > 7.9 6.0 – 7.9 < 6.0 Leptin (ng/mL) < 2 > 43 20 - 43 < 20 0.5 Leptin:BMI Ratio > 1.17 0.66 – 1.17 < 0.66 11 Adiponectin (µg/mL) < 10 10 - 14 > 14 Free Fatty Acid (mmol/L) 0.29 > 0.7 0.6 – 0.7 < 0.6 Ferritin (ng/mL) > 108 < 61 121 61 - 108 Insulin Resistance Laboratory Test Intermediate Risk Intermediate Risk Range Previous Results Notes High Risk Optimal High Risk Range Optimal Range α-hydroxybutyrate (µg/mL) 3.0 > 5.7 4.5 – 5.7 < 4.5 Oleic Acid (µg/mL) 19 > 79 60 - 79 < 60 19 18.1 Linoleoyl-GPC (µg/mL) 10.5 - 13 > 13 < 10.5 15.8 IRiScore < 2.0 2.0 - 10 > 10 HOMA-IR 1.5 > 4.2 2.6 – 4.2 < 2.6 ≥ 12 10 - 11 3 - 9 6 Insulin (uU/mL) 12 Proinsulin (pmol/L) > 16 8 - 16 < 8 Beta Cell Function 2.2 > 4.6 3.1 – 4.6 1.0 – 3.0 C-peptide (ng/mL) > 4.9 3.6 – 4.9 < 3.6 Proinsulin: C-peptide ratio 5.4 > 5 ≤ 5 < 5 Anti-GAD (IU/mL) Negative Positive
8.42 Campesterol (µg/mL) ≤ 2.10 ≥ 4.44 2.11 – 4.43 Campesterol ratio 102mmol/mol cholesterol 495 ≤ 114 115 - 240 ≥ 241 ≤ 1.42 ≥ 3.18 1.43 – 3.17 5.08 Sitosterol (µg/mL) Sterol Absorption Markers Sitosterol ratio 102mmol/mol cholesterol ≤ 75 ≥ 169 76 - 168 289 Cholestanol (µg/mL) 4.22 ≤ 2.01 ≥ 3.48 2.02 – 3.47 Cholestanol ratio 102mmol/mol cholesterol 256 ≤ 116 ≥ 195 117 - 194 ≤ 0.49 0.44 ≥ 1.28 0.50 – 1.27 Desmosterol Sterol Synthesis Markers Desmosterol ratio 102mmol/mol cholesterol ≤ 30 ≥ 65 31 -64 27 Campesterol, sitosterol (phytosterols) and cholestanol (an intestinal microbe produced cholesterol metabolite) and their ratios to total cholesterol serve as markers of cholesterol absorption. Desmosterol, the penultimate sterol in the Bloch cholesterol synthesis pathway and its ratio to cholesterol are biomarkers of cholesterol synthesis.
Statin Therapies for Elevated Lipid Levels Compared Across Doses to Rosuvastatin (STELLAR) 100 40 Campesterol Lathosterol 80 20 60 0 40 -20 20 Lathosterolchanges (%) Campesterol changes (%) 0 -40 -20 -60 -40 -80 -60 -100 -80 Rosuva Atorva Rosuva Atorva -100 -120 60 200 Sterol/Cholesterol Ratio Sterol/Cholesterol Ratio 40 150 20 100 0 Campesterol/C Ratio changes (%) -20 Lathosterol/C Ratio changes (%) 50 -40 0 -60 -50 -80 Rosuva Rosuva Atorva Atorva -100 -100 Marker of Increased Absorption Marker of Synthesis Inhibition van Himbergen et al. J Lipid Res 2009;50:730-739
Statins and Intestinal Cholesterol Absorption Intestinal absorption of [3H]-cholesterol in MetS rats treated with simvastatin (0.01% w/w, 8 weeks) Lymph was collected from the mesenteric lymph duct for 8 h following a gastric infusion of triolein containing [3H]-cholesterol in lean and MetS control rats, and MetS rats treated with simvastatin (MetS + SV) Data was presented as % of [3H]-cholesterol absorbed per ml of lymph. Values are mean ± s.e.m of n = 4 per group. ***p < 0.001 versus lean control. ^p < 0.05 versus untreated MetS rats. 2.0 1.5 ^ *** % [3H]-cholesterol absorption per ml of lymph 1.0 0.5 0.0 Lean MetS MetS + Simva Borthwick F et al Atherosclerosis 2014;232:141-148
Scandinavian Simvastatin Survival Study (4S) Simvastatin Efficacy: Relationship to Cholesterol Absorption Among individuals in the highest cholesterol absorption quartile, the number of coronary events actually increased by > 16%, but were significantly reduced by 38% in the lowest quartile after the 5-year follow-up period . Miettinen et al. concluded that patients with high baseline cholesterol synthesis (and low cholesterol absorption) seem to be responders, and those with low cholesterol synthesis (and high cholesterol absorption) are non-responders to statin therapy. BMJ 1998;316:1127–30. Quartiles of Cholesterol Absorption II 107-126 IV >148 III 127-148 I < 107 +20 +10 0 +16.6% -10 Change on hazard rtatio (%) -20 -24.7% -30 Quartile Cholestanol 102mmol/mol cholesterol -34.3% -40 -37.7% Placebo (434) Simvastatin 20- 40 mg (434) Weingärtner O et al. Atherosclerosis 210 (2010) 362–365
Gauging the lipid effects of RosuvAstatin plus ezetimibe Versus sImvastatin plus ezetimibe TherapY (GRAVITY) ap - 0.002 vs. SIM 40 mg/EZE 10 mg, bp < 0.001 vs. SIM 40 mg/EZE 10 mg Combination therapy Monotherapy 63.5b 59.7a 70 57.4 n = 204 55.2 n =210 n = 201 60 9.9 n = 199 13.2 11.0 50 14.3 40 % reduction in LDL-C levels 53.6 30 46.4 46.5 40.9 n = 199 20 n = 206 n = 197 10 0 RSV 10/Eze 10 RSV 20/Eze 10 SIM 40/Eze 10 SIM 80/Eze 10 Mean percentage change in LDL-C from baseline to end of monotherapy (week 0 to week 6; grey shaded boxes) and from end of monotherapy to end of combination therapy (week 6 to week 12; white boxes). Values above bars show overall changes from baseline to end of combination therapy (week 0 to week 12) Ballantyne CM et al. Atherosclerosis 2014;232:86-93
Campesterol (µg/mL) 2.62 ≤ 2.10 ≥ 4.44 2.11 – 4.43 Campesterol ratio 102mmol/mol cholesterol 193 ≤ 114 115 - 240 ≥ 241 40 Apo B (mg/dL) ≥ 80 60 - 79 < 60 64 ≤ 1.42 1022 ≥ 3.18 1.82 1.43 – 3.17 LDL-P (nmol/L) ≥ 1300 1000-1299 < 1000 521 Sitosterol (µg/mL) Sterol Absorption Markers 16 sdLDL-C (mg/dL) ≥ 31 21 - 30 ≤ 20 Sitosterol ratio 102mmol/mol cholesterol ≤ 75 Lipoprotein ≥ 169 130 76 - 168 % sdLDL (calculated) ≥ 23 14 - 22 ≤ 13 18 Cholestanol (µg/mL) 2.60 149 Apo A-I (mg/dL) < 130 130-150 ≥ 150 ≤ 2.01 ≥ 3.48 2.02 – 3.47 36.5 37.3 HDL-P (umol/L) < 28.0 28.0 – 34.0 ≥ 35 Cholestanol ratio 102mmol/mol cholesterol 197 ≤ 116 ≥ 195 117 - 194 ≤ 0.49 0.55 ≥ 1.28 0.50 – 1.27 Desmosterol Sterol Synthesis Markers Desmosterol ratio 102mmol/mol cholesterol 42 ≤ 30 ≥ 65 31 -64 Laboratory Test Intermediate Risk Intermediate Risk Range Previous Results Notes High Risk Optimal High Risk Range Optimal Range
Absorption of Baseline Cholesterol Synthesis / Absorption Markers with On-atorvastatin LDL-C • Association of baseline cholesterol synthesis/absorption markers with LDL-C reduction by atorvastatin. Q, quartile. • Data are expressed as means for continuous variables. ** P < 0.003 (0.05/15) • P values were calculated between subgroups with the highest lathosterol and campesterol patterns and other subgroups. • Subgroups with the highest lathosterol and campesterol patterns were defined as patients with the highest quartiles of lathosterol and campesterol. 42 42 42 45 33 36 40 37 33 39 36 35 ** 26 37 36 35 Mean Reductions of LDL-C (%) 30 ** 27 Q4 Q3 Q2 Quartiles of Baseline Campesterol (absorption marker) Q1 15 Q4 Q2 Q3 Q1 Quartiles of Baseline Lathosterol (synthesis marker) Qi Y et al. JLipid Res. 2013;54:3189–3197
Changes in Cholesterol Synthesis (A) and Cholesterol Absorption (B) Markers from Baseline Levels after Atorvastatin Treatment Quartiles of Baseline Lathosterol (Synthesis Marker) Quartiles of Baseline Lathosterol (Synthesis Marker) Quartiles of Baseline Campesterol (Absorption Marker) Quartiles of Baseline Campesterol (Absorption Marker) Q4 Q3 Q1 Q1 Q2 Q2 Q4 Q3 Q4 Q4 Q3 Q3 -15.2 -68.5 -8.5 -27.0 Q2 Q2 A -23.9 -73.9 B -14.9 -65.7 Q1 Q1 -19.6 -56.4 -71.4 -75.8 0 70 74.0 -44.8 -63.2 -35.8 -16.7 50 52.9 42.7 45.6 -20 30.8 30 15.6 4.6 6.5 10 Changes of Campesterol (%) Changes of Lathosterol (%) -17.3 -40 -23.7 -25.5 -18.8 -10 -40.5 -27.9 -45.0 -30 -65.8 -60 -50 -70 -80 Data are expressed as means for continuous variables Qi Y et al. JLipid Res. 2013;54(11):3189–97
Ezetimibe and Individual Changes in Neutral Sterol Excretion Neutral Sterol Endogenous Excretion % Recovery Endogenous (Plasma-derived) Cholesterol Total Neutral Sterol Excretion Neutral Sterol Mass Excreted per Day 10.0 5000 7.5 4000 %/day 3000 mg/day 5.0 2000 2.5 1000 0.0 Ezetimibe Placebo Ezetimibe Placebo p=0.035 p=0.019 Davidson MH et al Atherosclerosis 2013;230:322-329
Statin Therapies for Elevated Lipid Levels Compared Across Doses to Rosuvastatin (STELLAR) 100 40 Campesterol Lathosterol 80 20 60 0 40 -20 20 Lathosterolchanges (%) Campesterol changes (%) 0 -40 -20 -60 -40 -80 -60 -100 -80 Rosuva Atorva Rosuva Atorva -100 -120 60 200 Sterol/Cholesterol Ratio Sterol/Cholesterol Ratio 40 150 20 100 0 Campesterol/C Ratio changes (%) -20 Lathosterol/C Ratio changes (%) 50 -40 0 -60 -50 -80 Rosuva Rosuva Atorva Atorva -100 -100 Marker of Increased Absorption Marker of Synthesis Inhibition van Himbergen et al. J Lipid Res 2009;50:730-739
Scandinavian Simvastatin Survival Study (4S) Simvastatin Efficacy: Relationship to Cholesterol Absorption Among individuals in the highest cholesterol absorption quartile, the number of coronary events actually increased by > 16%, but were significantly reduced by 38% in the lowest quartile after the 5-year follow-up period . Miettinen et al. concluded that patients with high baseline cholesterol synthesis (and low cholesterol absorption) seem to be responders, and those with low cholesterol synthesis (and high cholesterol absorption) are non-responders to statin therapy. BMJ 1998;316:1127–30. Quartiles of Cholesterol Absorption II 107-126 IV >148 III 127-148 I < 107 +20 +10 0 +16.6% -10 Change on hazard rtatio (%) -20 -24.7% -30 Quartile Cholestanol 102mmol/mol cholesterol -34.3% -40 -37.7% Placebo (434) Simvastatin 20- 40 mg (434) Weingärtner O et al. Atherosclerosis 210 (2010) 362–365
Absorption of Baseline Cholesterol Synthesis / Absorption Markers with On-Atorvastatin LDL-C • Association of baseline cholesterol synthesis/absorption markers with LDL-C reduction by atorvastatin. Q, quartile • Data are expressed as means for continuous variables ** P < 0.003 (0.05/15) • P values were calculated between subgroups with the highest lathosterol and campesterol patterns and other subgroups • Subgroups with the highest lathosterol and campesterol patterns were defined as patients with the highest quartiles of lathosterol and campesterol 42 42 42 45 33 36 40 37 33 39 36 35 ** 26 37 36 35 30 Mean Reductions of LDL-C (%) ** 27 Q4 Quartiles of Baseline Campesterol (absorption marker) Q3 Q2 Q1 15 Q4 Q2 Q3 Q1 Quartiles of Baseline Lathosterol (synthesis marker) Qi Y et al. JLipid Res. 2013;54(11):3189–97
Changes in Cholesterol Synthesis (A) and Cholesterol Absorption (B) Markers from Baseline Levels after Atorvastatin Treatment Quartiles of Baseline Lathosterol (Synthesis Marker) Quartiles of Baseline Lathosterol (Synthesis Marker) Quartiles of Baseline Campesterol (Absorption Marker) Quartiles of Baseline Campesterol (Absorption Marker) Q4 Q3 Q1 Q1 Q2 Q2 Q4 Q3 Q4 Q4 Q3 Q3 -15.2 -68.5 -8.5 -27.0 Q2 Q2 A -23.9 -73.9 B -14.9 -65.7 Q1 Q1 -19.6 -56.4 -71.4 -75.8 0 70 74.0 -44.8 -63.2 -35.8 -16.7 50 52.9 42.7 45.6 -20 30.8 30 15.6 4.6 6.5 10 Changes of Campesterol (%) Changes of Lathosterol (%) -17.3 -40 -23.7 -25.5 -18.8 -10 -40.5 -27.9 -45.0 -30 -65.8 -60 -50 -70 -80 Data are expressed as means for continuous variables Qi Y et al. JLipid Res. 2013;54(11):3189–97