Debugging, benchmarking, tuning i.e. software development tools
Explore essential software development tools including IDEs, compilers, debuggers, and profilers for efficient code debugging, performance benchmarking, and optimization. Learn about version control, debugging techniques, and high-performance computing support.

Debugging, benchmarking, tuning i.e. software development tools
E N D
Presentation Transcript
Debugging, benchmarking, tuningi.e. software development tools Martin ČumaCenter for High Performance Computing University of Utah m.cuma@utah.edu
SW development tools • Development environments • Compilers • Version control • Debuggers • Profilers • Runtime monitoring • Benchmarking http://www.chpc.utah.edu
Programming tools http://www.chpc.utah.edu
Program editing • IDEs • Visual *, Eclipse • Text editors • vim, emacs, atom http://www.chpc.utah.edu
Compilers • Open source • GNU • Open64, clang, Mono • Commercial • Intel • Portland Group (PGI, owned by Nvidia) • Vendors (IBM XL, Cray) • Others (Absoft, CAPS, Lahey) http://www.chpc.utah.edu
Language support • Languages • C/C++ - GNU, Intel, PGI • Fortran – GNU, Intel, PGI • Interpreters • Matlab – has its own ecosystem (debugger, profiler) • Java – reasonable ecosystem, not so popular in HPC, popular in HTC • Python – ecosystem improving, some tools can plug into Python (e.g. Intel VTune) http://www.chpc.utah.edu
Language/library support • Language extensions • OpenMP (4.0+*) – GNU, Intel*, PGI • OpenACC – PGI, GNU very experimental • CUDA – Nvidia GCC, PGI Fortran • Libraries • Intel Math Kernel Library (MKL) • PGI packages open source (OpenBLAS?). http://www.chpc.utah.edu
Version control • Copies of programs • Good enough for simple code and quick tests/changes • Version control software • Allow code merging, branching, etc • Essential for collaborative development • RCS, CVS, SVN • Git – integrated web services, free for open source, can run own server for private code (gitlab) http://www.chpc.utah.edu
Debugging http://www.chpc.utah.edu
Program errors • Crashes • Segmentation faults (bad memory access) • often writes core file – snapshot of memory at the time of the crash • Wrong I/O (missing files) • Hardware failures • Incorrect results • Reasonable but incorrect results • NaNs – not a numbers – division by 0, … http://www.chpc.utah.edu
write/printf • Write variables of interest into the stdout or file • Simplest but cumbersome • Need to recompile and rerun • Need to browse through potentially large output http://www.chpc.utah.edu
Terminal debuggers • Text only, e.g. gdb, idb • Need to remember commands or their abbreviations • Need to know lines in the code (or have it opened in other window) • Useful for quick code checking on compute nodes and core dump analysis http://www.chpc.utah.edu
GUI debuggers • Have graphical user interface • Some free, mostly commercial • Eclipse CDT (C/C++ Development Tooling), PTP (Parallel Tools Platform) - free • PGI’s pdbg – part of PGI compiler suite • Intel development tools • Rogue Wave Totalview - commercial • Allinea DDT - commercial http://www.chpc.utah.edu
Totalview and DDT • The only real alternative for parallel or accelerator debugging • Cost a lot of money (thousands of $), but, worth it • We had Totalview license (for historical reasons), 32 tokens enough for our needs (renewal ~$1500/yr) • In 2017 we switched to DDT which gave us competitive upgrade • XSEDE systems have DDT http://www.chpc.utah.edu
1. Compile binary with debugging information flag -g gcc –g test.f –o test 2. Load module and run Totalview or DDT module load totalview ; module load ddt TV/DDT + executable totalview executable ; ddt executable TV/DDT + core file totalview executable core_file ; ddt executable corefile Run TV/DDT and choose what to debug in a startup dialog totalview ; ddt How to use Totalview/DDT http://www.chpc.utah.edu
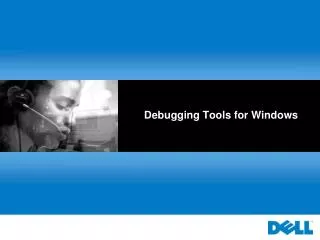
Totalview windows http://www.chpc.utah.edu
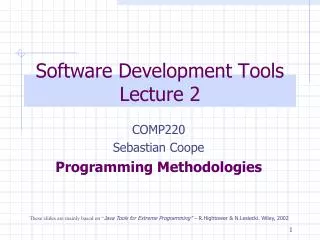
DDT screenshot http://www.chpc.utah.edu
Debugger basic operations • Data examination • view data in the variable windows • change the values of variables • modify display of the variables • visualize data • Action points • breakpoints and barriers (static or conditional) • watchpoints • evaluation of expressions http://www.chpc.utah.edu
Multiprocess debugging • Automatic attachment of child processes • Create process groups • Share breakpoints among processes • Process barrier breakpoints • Process group single-stepping • View variables across procs/threads • Display MPI message queue state http://www.chpc.utah.edu
Code checkers • Compilers check for syntax errors • lint based tools • Runtime checks through compiler flags (-fbounds-check, -check*, -Mbounds) • DDT has a built in syntax checker • Matlab does too • Memory checking tools - many errors are due to bad memory management • valgrind – easy to use, many false positives • Intel Inspector – intuitive GUI http://www.chpc.utah.edu
Intel software development products • We have a 2 concurrent user license + 2 just for compilers • One license locks all the tools • Cost ~$4000/year + ~$1000 for the compilers • Free for students, open source developers, educators • Tools for all stages of development • Compilers and libraries • Verification tools • Profilers • More info - https://software.intel.com/en-us/intel-parallel-studio-xe http://www.chpc.utah.edu
Intel Inspector • Thread checking • Data races and deadlocks • Memory checker • Like leaks or corruption • Good alternative to Totalview or DDT • Standalone or GUI integration • More info http://software.intel.com/en-us/intel-inspector-xe/ http://www.chpc.utah.edu
Intel Inspector • Source the environment module load inspectorxe • Compile with –tcheck -g ifort -openmp -tcheck -g trap.f • Run tcheck inspxe-gui – graphical user interface inspxe-cl – command line • Tutorial https://software.intel.com/en-us/articles/inspectorxe-tutorials http://www.chpc.utah.edu
Intel Trace Analyzer and Collector • MPI profiler and correctness checker • Detects violations of MPI standard and errors in execution environment • To use correctness checker module load intel impi itacsetenv VT_CHECK_TRACING 0mpirun –check-mpi –n 4 ./myApp • ITAC documentation https://software.intel.com/en-us/intel-trace-analyzer-support/documentation http://www.chpc.utah.edu
Profiling http://www.chpc.utah.edu
Why to profile • Evaluate performance • Find the performance bottlenecks • Inefficient programming • Array data access, optimized functions, vectorization • Memory or I/O bottlenecks • Parallel scaling • Inefficient parallel decomposition, communication http://www.chpc.utah.edu
Program runtime • Time program runtime • get an idea on time to run and parallel scaling • Many programs include benchmark problems • Some also accessible via “make test” • Consider scripts, especially if doing parallel performance evaluation http://www.chpc.utah.edu
Profiling categories • Hardware counters • count events from CPU perspective (# of flops, memory loads, etc) • usually need Linux kernel module installed (>2.6.31 has it) • Statistical profilers (sampling) • interrupt program at given intervals to find what routine/line the program is in • Event based profilers (tracing) • collect information on each function call http://www.chpc.utah.edu
Hardware counters • CPUs include counters to count important events • Flops, instructions, cache/memory access • Access through kernel or PAPI (Performance Application Programming Interface) • Tools to analyze the counters • perf - hardware counter collection,part of Linux • oprofile – profiler + hw counters • Intel VTune • Drawback – harder to analyze the profiling results (exc. VTune) http://www.chpc.utah.edu
Serial profiling • Discover inefficient programming • Computer architecture slowdowns • Compiler optimizations evaluation • gprof • Compiler vendor supplied (e.g. pgprof, nvvp) • Intel tools on serial programs • AdvisorXE, VTune http://www.chpc.utah.edu
HPC open source tools • HPC Toolkit • A few years old, did not find it as straightforward to use • TAU (Tuning and Analysis Utilities) • Lots of features, which makes the learning curve slow • Score-P/Scalasca • Developed by European consortium, did not try yet http://www.chpc.utah.edu
Intel tools • Intel Parallel Studio XE 2017 Cluster Edition • Compilers (C/C++, Fortran) • Math library (MKL) • Threading library (TBB) • Thread design and prototype (Advisor) • Memory and thread debugging (Inspector) • Profiler (VTune Amplifier) • MPI library (Intel MPI) • MPI analyzer and profiler (ITAC) http://www.chpc.utah.edu
Intel VTune Amplifier • Serial and parallel profiler • Multicore support for OpenMP and OpenCL on CPUs, GPUs and Xeon Phi • Quick identification of performance bottlenecks • Various analyses and points of view in the GUI • Makes choice of analysis and results inspection easier • GUI and command line use • More info https://software.intel.com/en-us/intel-vtune-amplifier-xe http://www.chpc.utah.edu
Intel VTune Amplifier • Source the environment module load vtune • Run VTune amplxe-gui – GUI amplxe-cl – CLI Can be used also for remote profiling (e.g. on Xeon Phi) • Tuning guides for specific architectures https://software.intel.com/en-us/articles/processor-specific-performance-analysis-papers http://www.chpc.utah.edu
Intel Advisor • Vectorization advisor • Identify loops that benefit from vectorization, find what is blocking efficient vectorization • Useful for speeding up loop performance • Thread design and prototyping • Analyze, design, tune and check threading design • Useful for implementing OpenMP in serial code • More info http://software.intel.com/en-us/intel-advisor-xe/ http://www.chpc.utah.edu
Intel Advisor • Source the environment module load advisorxe • Run Advisor advixe-gui – GUI advixe-cl – CLI • Create project and choose appropriate modeling • Getting started guide https://software.intel.com/en-us/get-started-with-advisor http://www.chpc.utah.edu
Intel Trace Analyzer and Collector • MPI profiler • traces MPI code • identifies communication inefficiencies • Collector collects the data and Analyzer visualizes them • More info https://software.intel.com/en-us/intel-trace-analyzer http://www.chpc.utah.edu
Intel TAC • Source the environment module load itac • Using Intel compilers, can compile with –trace mpiifort -openmp –trace trap.f • Run MPI code mpirun –trace –n 4 ./a.out • Run visualizer traceanalyzer a.out.stf & • Getting started guide https://software.intel.com/en-us/get-started-with-itac-for-linux http://www.chpc.utah.edu
Runtime monitoring http://www.chpc.utah.edu
Why runtime monitoring? • Make sure program is running right • Hardware problems • Correct parallel mapping / process affinity • Careful about overhead http://www.chpc.utah.edu
Runtime monitoring • Self checking • ssh to node(s), run “top”, or look at “sar” logs, “dmesg”, “taskset”, … • SLURM (or other scheduler) logs and statistics • LBNL’s Node Health Check (nhc) • Tools • XDMoD – XSEDE Metrics on Demand (through SUPReMM module) • REMORA - REsource MOnitoring for Remote Applications http://www.chpc.utah.edu
BENCHMARKing http://www.chpc.utah.edu
Why to benchmark? • Evaluate system’s performance • Testing new hardware • Verify correct hardware and software installation • New cluster/node deployment • There are tools for cluster checking (Intel Cluster Checker, cluster distros, …) • Checking newly built programs • Sometimes we leave this to the users http://www.chpc.utah.edu
New system evaluation • Simple synthetic benchmarks • FLOPS, STREAM • Synthetic benchmarks • HPL – High Performance Linpack – dense linear algebra problems – cache friendly • HPCC – HPC Challenge Benchmark – collection of dense, sparse and other (FFT) benchmarks • NPB – NAS Parallel Benchmarks – mesh based solvers – OpenMP, MPI, OpenACC implementations http://www.chpc.utah.edu
New system evaluation • Real applications benchmarks • Depend on local usage • Gaussian, VASP • Amber, LAMMPS, NAMD, Gromacs • ANSYS, Abaqus, StarCCM+ • Own codes • Script if possible • A lot of combinations of test cases vs. number of MPI tasks/OpenMP cores http://www.chpc.utah.edu
Cluster deployment • Whole cluster • Some vendors have cluster verification tools • We have a set of scripts that run basic checks and HPL at the end • New cluster nodes • Verify received hardware configuration, then rack • Basic system tests (node health check) • HPL – get expected performance per node (CPU or memory issues), or across more nodes (network issues) http://www.chpc.utah.edu
What else do you do at your site? http://www.chpc.utah.edu
Backup http://www.chpc.utah.edu
Demos • Totalview • Advisor • Inspector • VTune http://www.chpc.utah.edu