POLICY &
Explore a new way of discussing indicators with a focus on ESIP, a young but impactful initiative under GOMC. Dive into the significance of expert-selected indicators across seven key theme areas for effective policy-making. Enhance understanding through webtools and proposed mobile app features. Ready to shape policy? Contact ctilburg@securespeed.us for more.

POLICY &
E N D
Presentation Transcript
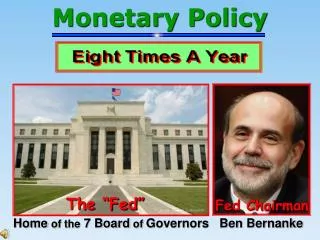
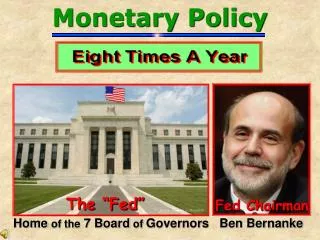
POLICY & INDICATORS Why isn’t this working? Or is it?
Can we talk indicators in a new way? • According to a TED Talk by John Bohannon bad Powerpoints are a $250 million/day drain to our global economy so…. • Suggestions to use dance instead of Powerpoint? • If you’ve been to a “Christine” TM talk recently, you know that I’ve allowed people to vote on what I talk about….I’m still experimenting….
What is ESIP? • ESIP is quite young. Active since 2006 – getting our toes wet compared with other efforts in the region - but under the umbrella of GOMC (which is over 20 years old).
What is ESIP? • ESIP is NOT gift-wrapping indicators and handing it to people in policy positions….. • ESIP is composed of policy makers (along with academics, research scientists, historians…..)
The ESIP process in the GOM • Identified the purposes of the indicators • Look at status and trends in the Gulf of Maine in a scientific and unbiased way • Locate information on those indicators • Stress the importance of pre-existing monitoring programs
Gulf of Maine • ESIP has tapped into expert advisors to select 23 indicators • These 23 indicators are subdivided into seven theme areas • Aquaculture • Aquatic habitats • Contaminants • Coastal Development • Climate Change • Eutrophication • Fisheries
Example: Contaminants Theme First conference call October 2007 Fact Sheet to be released April 2013 And in here?
Just….. • Hundreds of hours of conference calls, e-mails, GIS hours, analysis….etc….. • Also: the idea that for big ideas one should use few words to make things easier to understand - OTHERWISE KNOWN AS - holding ~ 20 scientists to a four page fact sheet.
But…here is the hard part…. • Is this the hurdle or the barrier….
Getting the information out… • Talk nerdy to me? Webtools • On the fly? You see/I see “app” • Give me the info as brief as possible: fact sheets
Talk nerdy to me? Webtools Mapping platform allows user to select any information used with ESIP’s indicators.
Talk nerdy to me? Webtools User can locate any station location and graph time series (if appropriate) or download datasets.
On the fly? You see/I see “app” • Proposal crafted for mobile app • Utilizes sentinel sites and “user’s choice sites” • Collects images and user information • Real-time information about beach erosion, seasonal responses, etc.
Which of those fits our users who are shaping policy? • If we go back to Slide 4
Which of those fits our users who are shaping policy? • If we go back to Slide 4
So, how do we know? • ESIP 2.0 • A new frontier. • Choosing indicators that fairly assess policy.
Questions Christine Tilburg ctilburg@securespeed.us www.gulfofmaine.org/esip


![FISCAL POLICY [“G” and “T”]](https://cdn3.slideserve.com/5787261/fiscal-policy-g-and-t-dt.jpg)