Download
1 / 23
230 likes | 324 Vues
This presentation outlines the objectives, goals, and views of the California Water Plan Advisory Committee meeting held on April 14th, 2005. It focuses on the importance of quantitative information, scenarios, response packages, and water portfolios to improve water management strategies in the state. The aim is to provide a comprehensive understanding of the California water management system, anticipate future changes by 2030, and identify effective responses to potential challenges. The presentation emphasizes the significance of informed decision-making, policy discussions, and planning for a sustainable water future in California.

E N D
Scenarios and More California Water Plan Advisory Committee Meeting April 14th, 2005
Objectives for Presentation • Review goals for quantitative information • Provide context for scenarios • Summarize scenarios and comments • Describe next steps
Goals Why We Want Quantitative Information
Big Picture for Numbers • Enhance shared understanding of California water management system • Illustrate recent conditions • Consider what changes are likely between now and 2030 • Identify and test promising responses to expected changes
Views of California Water Management • California water management is a large topic • Too large to “see” from a single view • Multiple views can provide a more complete picture
Multiple Quantitative Views • Water Portfolios • Describe where water originates, where it flows, and what it is used for based on recent data • Future Scenarios • Describe expected changes by 2030 if water managers do not take additional action • Alternative Response Packages • Describe packages of promising actions, predict expected outcomes, and compare performance under each scenario
Responses Putting the Views Together Present Future State of the System Scenarios Objectives Alternative Response Packages Water Portfolios State of the System Evaluate
The Point • More complete view of water management system will: • Help inform policy discussions • Promote rational decisions regarding investments to meet objectives • Support regional planning • Support statewide planning
What vs. How • The what: • Water portfolios • Scenarios • Alternative Response Packages • The how: • Observable data • Causal relationships • Analytical tools Agree on the what Working on the how
Quantitative Information Update 2005 vs. Update 2010
Update 2005 Describe quantitative approach Illustrate part of the approach – future scenarios More to come… Update 2010 Refine quantitative approach Refine future scenarios Quantify response packages Compare performance Analysis in Phases
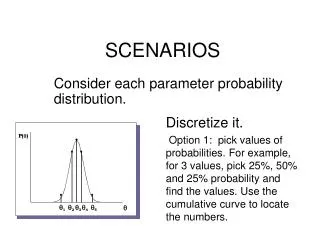
Scenarios in Update 2005 • Identify important factors likely to change independent of water managers • Acknowledge uncertainty in planning for future • Quantify plausible changes and effects • Indicate what could happen if we do not take additional management action
Summary of Partial Application • Potential changes in demand do not represent future shortages • Consider factors independent of water managers • Do not consider how or whether demands could be met • Future supply availability and response packages not quantified yet
Implications • Scenarios suggest demand for water in California can change significantly by 2030 • Changes could include shifts in demand by sector or shifts in demand by region • Potentially large changes underscore the importance of continuing to improve our understanding of the system and prepare for an uncertain future
Comments & Responses • C: Estimates are called “waterdemands”, when they are actually “water uses”. • R: Technically water quantity demand for given price, climate, population, etc. • C: There is no economic presentation or discussion of water demands/uses. • R: Economic assumptions are discussed in appendix article.
Comments & Responses • C: We do not see any mention of the role which water pricing can play in water use. • R: Price is fixed for this analysis. Water prices are currently set independent of management objectives. The potential role of changing price will be explored more when evaluating possible management responses.
Comments & Responses • C: This approach continues to be reactive, responding to changes over which we have no control. • R: The current information contained in Scenarios does not, and is not meant to, describe responses. Only what might happen independent of water manager action. Analysis of Responses will be in 2010.
Comments & Responses • C: DWR sets out three scenarios without recommending to decision makers which scenario is preferred. • R: The scenarios represent would could happen to demand, irregardless of preference. Update 2010 will add the evaluation of Responses to the possible futures. Recommendations will be made based on comparative performance.
Comments & Responses • C: We recommend that DWR put forth a positive philosophy for public investment, one that emphasizes resource protection, cost-effectiveness, and Environmental Justice. • R: DWR will be able to make recommendations when analysis includes evaluation and comparison of Alternative Response Packages.
Comments & Responses • C: “Current Trends” and “More Resource Intensive” do not mention the effect of not meeting CALFED ERP requirements. • R: The quantitative results in Update 2005 do not address the effects on any sector. That will be addressed in 2010.
Summary • New approach includes: • Water Portfolios • Future Scenarios • Alternative Response Packages • Update 2005 presents numbers for: • Water Portfolios • The demand portion of Future Scenarios
Next Steps – Update 2010 • Prioritize information to compute for 2010 based on evaluation criteria • Document current understanding of key conceptual relationships between observable data • Select data and tools to use for analyses • Develop work plan that specifies how analyses will be conducted for Update 2010 Complete these tasks in Q1 2006