
Uploaded by
winter-decker
2 SLIDES
142 VUES
20LIKES
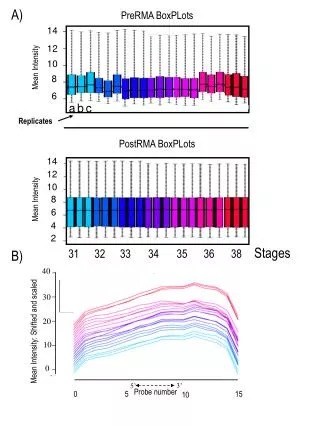
Analysis of Mean Intensity Post-RMA with Box Plots for Replicates and Probe Shifts
DESCRIPTION
This analysis explores the mean intensity data of differential gene expression through box plots generated before and after Robust Multi-array Average (RMA) normalization. It covers replicates and compares histograms of mean intensities across various stages (31 to 38). Additionally, it evaluates the effects of shifting and scaling the data with different probe numbers. The study provides insights into the trends in mean intensities, highlighting comprehensive visualizations and metrics that aid in understanding expression data variations.
Download
1 / 2
Download Presentation

Télécharger la présentation
Analysis of Mean Intensity Post-RMA with Box Plots for Replicates and Probe Shifts
An Image/Link below is provided (as is) to download presentation
Download Policy: Content on the Website is provided to you AS IS for your information and personal use and may not be sold / licensed / shared on other websites without getting consent from its author.
Content is provided to you AS IS for your information and personal use only.
Download presentation by click this link.
While downloading, if for some reason you are not able to download a presentation, the publisher may have deleted the file from their server.
During download, if you can't get a presentation, the file might be deleted by the publisher.
E N D


More Related
Audio
Live Player