Download
1 / 16
160 likes | 213 Vues
WESTCAS - Shortage Impacts on AZ CAP General Manager David Modeer October 29, 2014. Central Arizona Project. 336-mile aqueduct stretches from Lake Havasu to Tucson 14 pumping plants lift water nearly 3,000 feet 8 siphons, 3 tunnels Lake Pleasant/New Waddell Dam

E N D
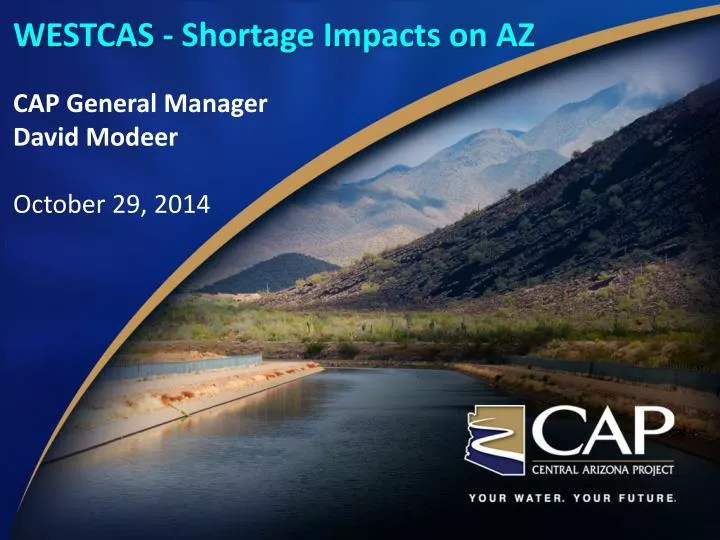
WESTCAS - Shortage Impacts on AZ CAP General Manager David Modeer October 29, 2014
Central Arizona Project 336-mile aqueduct stretches from Lake Havasu to Tucson 14 pumping plants lift water nearly 3,000 feet 8 siphons, 3 tunnels Lake Pleasant/New Waddell Dam Annually delivers approx. 520 billion gallons (1.6 mill acre-feet) Delivery of Colorado River water began in 1985 in Maricopa County Construction complete in 1993 ARIZONA
CAP System Power Usage CAP is the single largest end-user of power in Arizona. CAP uses about 2,800,000 megawatt hours of electrical energy each year.
Where Does CAP Get Its Power? 95% of the energy used by CAP is produced at the Navajo Generating Station near Page, Arizona. CAP, through the Bureau of Reclamation, has access to nearly 25% of the power produced.
Background and Importance of NGS • Constructed in the early 1970s on the Navajo Reservation near Page, AZ, to provide power to the CAP as an alternative to two additional dams in the vicinity of the Grand Canyon • 3 coal-fired units, total net output of 2,250 megawatts (MW) • Operated by the Salt River Project (SRP) on behalf of six participants • Provides 95% of power required by CAP • Surplus power from the BOR’s share of NGS is sold to help fund CAP repayment, which in turn funds Indian water rights settlements APS 14.0% NV Energy 11.3% USBR (CAP) 24.3% SRP 21.7%
Benefits to CAP of TWG Agreement • EPA released its final rule in July 2014 • Ensures the viability of NGS to 2044 • Provides certainty that stable and reliable power supplies are available for decades • Significantly delays the cost of SCR, potentially until 2030 • Preserves CAP's ability to fund Arizona's repayment obligation for construction of the CAP system through the sale of surplus NGS power
Interim Guidelines (2007) Basin States agreement in 2006 on conjunctive management of Lakes Powell and Mead and shortage sharing in the Lower Basin • Adopted by Secretary in 2007 • Effective through water year 2026 • Renegotiation to start by 2020
2007 Guidelines • Lower Basin apportionments are reduced when Lake Mead falls below specified elevations: ElevationReduction 1075’ 333,000 AF 1050’ 417,000 AF 1025’ 500,000 AF • If Lake Mead is projected to fall below elevation 1000, the Secretary will consult with Basin States to discuss further measures
Shortage Sharing • Arizona and Nevada share Lower Basin shortages under the 2007 Guidelines • Mexico voluntarily agreed in Minute 319 to accept reductions in its deliveries at the same elevations No reductions to California under 2007 Guidelines
2017 Level 1 Shortage Other Excess Shortage (157,000) 1.5 MAF 320,000 Low Ag Pool Shortage (163,000) Ag Pool137,000 NIA Priority 225,000 1.0 MAF CAP Delivery Priority Indian Priority 317,000 M&I Priority 471,000 0.5 MAF High Priority 3 68,400 0 MAF
Lake Mead Since 2000 91% Full (25 MAF) 12.52 MAF Powell Release 35% Full (9.6 MAF)
Impact of “Structural Deficit” • Results in a decline of 12+ feet in Lake Mead every year when releases from Powell are “normal” (8.23 MAF) • Undermines effectiveness of the 2007 Guidelines • Drives Lower Basin to shortage • CAP forced to bear obligations of others • Evaporation and other system losses • Lower Basin’s half of Mexican Treaty obligation • US failure to operate YDP
Risk to All Colorado River Users • Without equalization or corrective action, Lake Mead will fall below elevation 1000 in 5-8 years • If Lake Mead is below elevation 1000: • Impacts SNWA ability to withdraw water • Less than 4.5 MAF left in storage in Lake Mead • Reduced power generation and efficiency at Hoover Dam, potential cavitation or vibration damage • What will the Secretary of the Interior do?
Drought Response Plan • Based on principle that all Colorado River water and power users share risk • CAP and ADWR are working with Basin States and Reclamation to prepare a “Drought Response and Sustainability Plan” • Ongoing efforts • Expand weather modification and tamarisk removal • Pilot System Conservation Agreement • Yuma Desalting Plant pilot run • Innovative Conservation Program grants • Long-term augmentation studies
Current Status • Lake Mead is at elevation • 1081 feet = 39% capacity • 2015 – no shortage • 2016 - 36% probability • 2017 – 58% probability • CAP is working on a reservoir protection plan with other Lower Basin water users and taking steps to protect Lake Mead