Download
1 / 72
1.64k likes | 4.41k Vues
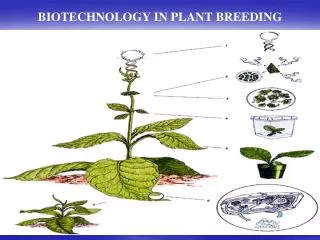
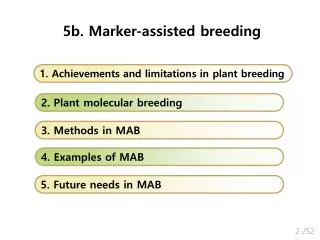
5b. Marker-assisted breeding. 1. Achievements and limitations in plant breeding. 2. Plant molecular breeding. 3. Methods in MAB. 4. Examples of MAB. 5. Future needs in MAB. 2 /52. 1. Achievements and limitations in plant breeding. 연대별 세계 3 대 곡물의 수량. GM maize. Maize.

E N D
5b. Marker-assisted breeding 1. Achievements and limitations in plant breeding 2. Plant molecular breeding 3. Methods in MAB 4. Examples of MAB 5. Future needs in MAB 2 /52
1. Achievements and limitations in plant breeding 연대별 세계 3대 곡물의 수량 GM maize Maize Grain yield (ton/ha) Rice Wheat Year interval 3 /52
전통육종의 한계 인공교배 가능자원만 활용 가능 가용 유전자원 제한 인공교배, 무작위 돌연변이, 염색체변이 이용 유전변이 창출 제한 경험, 선발정확성 결여, 환경 영향 배제 불가 표현형 선발 의존 Epistasis무시 선발, 유전자 집적 어려움 유전자간 상호작용 선발 불가 고정계통 육성시 장시간 소요 약배양, shuttlebreeding, early-G testing 5 /52
+ + 2. Plant molecular breeding Advancement of breeding methods Genome Genetics DNA 1900 1953 BC 8,000 AD 1819 2000 1985 1903 1909 1911 1927 1934 1994 Breeding by seperation (Farmers) Cross breeding Breeding by Seperation (Breeders) Heterosis breeding Polyploid breeding Mutation breeding Tissue culture Molecular marker Transgenic crops PCR Molecular map White, Tomato roottip culture Tomato FlvrSavr Chromosome Molecular Breeding 6 /52
Marker-assisted breeding Transgenic breeding Goal: Creation of new variation Goal: Introduction of new alleles Genetic recombination Promotor Foreign gene Gene Genomics Vector Molecular map QTL X Selection system Molecular markers Transgenic plants Marker-assisted selection Genomics-assisted breeding Hybridization breeding Genetic fixation Genetic fixation New variety GM crops 7 /52
Paradigm Changes in Plant Breeding Creation of novel variation Transgenic Breeding Extendedto Unrelated species Related germplasms Sexual gene transfer No sexual limit Random mutation Targeted mutagenesis Selection criteria Qualitative Quantitative Genes Gene networks Traits Marker-/genomics- assisted breeding Gene expression networks Protein interaction Trait x Trait interaction G x E interaction Gene expression x E interaction Phenotypic selection Genotypic selection 74/101
Anticipated impact of improvements in agronomics, breeding, and biotechnology on average corn yields in the USA Expected contribution 46% 27% 16% 11% 2005 대비 125% 증수 60% 40% Edgerton (2009) Plant Physiol. 149: 7-13
3. Methods in MAB Type of DNA markers 8 /52
육종적 활용 Some definition on DNA markers Sequence information Chromosome ㆍㆍ 1 2 3 4 Majorgene/QTL Linked marker Gene-based marker (functional) Linked marker MinorQTLs Target major gene minorQTLs for a target trait 14/48
Application of markers in plant breeding 1. DNA fingerprinting - variety identification - purity evaluation - genotype determination (heteroz/homoz) - estimation of variation - analysis of lineage (parentage) - comparison of genomes 2. Marker-assisted selection - marker-assisted selection - marker-assisted backcrossing - QTL analysis 3. Mapping / mab-based gene isolation 9 /52
Somedefinitions • Marker-assisted breeding(MAB) • Marker-assisted selection (MAS) – from a combination of phenotypic value and marker information • Marker-assisted backcrossing (MABC) • Marker-assisted recurrent selection (MARS) • Genomic Selection or Genome-wide (GS or GWS) • Select for breeding values summed across many markers without estimation of QTL (KlingJ, Oregon SU) 10/52
Advantages of MAS 1. naturally occurring / neutral 2. heritability = 1 (no environm. effect) 3. usually codominant (identification of all genotypes) 4. can be done from DNA extracts of small plants (often before target characters are actually expressed) 5. non-dustructive 6. simultaneous assays for multiple targets * Disadvantages; 1. expensive 11/52
Potential benefits from MAS • more accurate and efficient selection of specific genotypes • May lead to accelerated variety development • more efficient use of resources • Especially field trials Crossing house Backcross nursery 12/52
MAS will be useful for 1. Low heritability characters (normally require progeny testing) 2. Traits expensive to score (e.g. secondary metabolites) 3. Multiple characters (e.g. sequential disease screening) * gene pyramiding 4. Recessive characters 13/52
Considerations for using DNA markers in plant breeding • Technical methodology • simple or complicated? • Reliability of marker scoring • Degree of polymorphism • Cost** • Available resources • Equipment, technical expertise • Integration with breeding programs 14/52
Steps for genomics-marker development 1. Association test of certain traits with markers : Mapping, tagging, QTL analysis 2. Fine mapping of target gene or QTL region : development of positional markers using genomics DBs available at Websites 3. Candidate gene analysis 4. Confirmation of the gene by transgenic approach or complementation test Linked markers Gene- specific markers 15/52
1 2 3 4 1 2 3 4 1 2 3 4 Target locus RECOMBINANT SELECTION TARGET LOCUS SELECTION BACKGROUND SELECTION 3.1 Marker-assisted backcrossing (MABC) (Mackill, 2010) • MAB has several advantages over conventional backcrossing: • Effective selection of target loci • Minimize linkage drag • Accelerated recovery of recurrent parent FOREGROUND SELECTION BACKGROUND SELECTION 16/52
F1 F1 • Markers can be used to greatly minimize the amount of donor chromosome. Conventional backcrossing (Phenotypic selection) c c TARGET GENE BC1 BC2 BC3 BC10 BC20 Marker-assisted backcrossing c TARGET GENE Ribaut, J.-M. & Hoisington, D. 1998 Marker-assisted selection: new tools and strategies. Trends Plant Sci.3, 236-239. BC1 BC2 17/52
3.2 Gene pyramiding • Widely used for combining multiple disease resistance genes for specific races of a pathogen • Pyramiding is extremely difficult to achieve using conventional methods • Consider: phenotyping a single plant for multiple forms of seedling resistance – almost impossible • Important to develop ‘durable’ disease resistance against different races 18/52
Process of combining several genes, usually from 2 different parents, together into a single genotype Breeding plan Genotypes P1 Gene A x P1 Gene B P1: AAbb P2: aaBB x F1 Gene A + B F1: AaBb F2 MAS Select F2 plants that have Gene A and Gene B 19/52
3.3 Early generation MAS • MAS conducted at F2 or F3 stage • Plants with desirable genes/QTLs are selected and alleles can be ‘fixed’ in the homozygous state • plants with undesirable gene combinations can be discarded • Advantage for later stages of breeding program because resources can be used to focus on fewer lines References: Ribaut & Betran (1999). Single large-scale marker assisted selection (SLS-MAS). Mol Breeding 5: 21-24. 20/52
P1 x P2 Susceptible Resistant F1 F2 large populations (e.g. 2000 plants) MAS for 1 QTL – 75% elimination of (3/4) unwanted genotypes MAS for 2 QTLs – 94% elimination of (15/16) unwanted genotypes 21/52
SINGLE-LARGE SCALE MARKER-ASSISTED SELECTION (SLS-MAS) P1 x P2 F1 MAS F2 Only desirable F3 lines planted in field F3 Families grown in progeny rows for selection. Pedigree selection based on local needs F4 F5 F6 F7 Multi-location testing, licensing, seed increase and cultivar release F8 – F12 PEDIGREE METHOD P1 x P2 F1 Phenotypic screening F2 Plants space-planted in rows for individual plant selection F3 Families grown in progeny rows for selection. F4 F5 Preliminary yield trials. Select single plants. F6 Further yield trials F7 Multi-location testing, licensing, seed increase and cultivar release F8 – F12 Benefits: breeding program can be efficiently scaled down to focus on fewer lines 22/52
3.4 Combined approaches • In some cases, a combination of phenotypic screening and MAS approach may be useful • To maximize genetic gain (when some QTLs have been unidentified from QTL mapping) • Level of recombination between marker and QTL (in other words marker is not 100% accurate) • To reduce population sizes for traits where marker genotyping is cheaper or easier than phenotypic screening 23/52
P1(S) x P2 (R) ‘Marker-directed’ phenotyping (Also called ‘tandem selection’) Donor Parent Recurrent Parent • Use when markers are not 100% accurate or when phenotypic screening is more expensive compared to marker genotyping F1(R)x P1(S) BC1F1 phenotypes: R and S MARKER-ASSISTED SELECTION (MAS) 1 2 3 4 5 6 7 8 9 10 11 12 13 14 15 16 17 18 19 20 … SAVE TIME & REDUCE COSTS PHENOTYPIC SELECTION *Especially for quality traits* References: Han et al (1997). Molecular marker-assisted selection for malting quality traits in barley. Mol Breeding 6: 427-437. 24/52
Genome-wide association study 개념 • - Genome 전체에서 minor QTL까지 동정하고 각 QTL의기여도를 분석하는 방법 • - Genome 전체의 조밀한 마커(SNP ~30k 등)와 형질값과의association 분석 (SNP) 형질차이 있는 두 집단간 비교 Cumulative additive effects of each QTL genomic estimated breeding value (GEBV) for the target trait in breeding lines http://en.wikipedia.org/wiki/Genome-wide_association_study 17/48
GWA scans for traits using 918 SNPs inBarley 224 보리 유전자원 분석 (P-value = 0.03) 출수기 초장 종자1000립중 전분함량 조단백함량 • a total of 171 significant marker trait associations Pasamet al (2012) BMC Plant Biol.12:16 18/48
Association study between phenotypes and sequence variation in rice (a) (b) Summary of trait associations across genomic regions and percentage of variance explained by significant locus. (a) Each row represents a trait, and each column corresponds to a genomic region containing multiple SNPs that are significantly associated with a trait. (b) The x axis represents the trait, the y axis shows the contribution (%) of significant loci. Candidate genes detected within 200 Kb region of significant loci are labelled on top of the maximum effect locus. 19/48 Zhao et al, 2011 Nat Comm
Genotypingby sequencing (GBS) • NGS에비해비용절감, 단순화한 SNP 분석방법 • 적용범위 : 마커개발, mapping, GS 등 거의모든 유전육종분야 http://www.lifetechnologies.com 20/48
In silicoanalysis of restriction enzyme sites for GBS Mse1: 4b cutter ApeK1: 5b Pst1: 6b Elshire etal (2011) PLOSone 6: e19379 soybean genome Sona etal (2013) PLOSone 8: e54603 21/48
3.5. Errorrate in MAS • F2 에서(M/m: marker allele, A/a: target gene allele) • A/a 와 M/m 간의조환가를 c (coupling)으로놓으면 • MMAA x mmaa 교배시 F2에서의분리는
가. Recessive allele ‘a’를 간접선발할 경우 • DNA 마커 mm을선발한다면 총 선발되는 개체는 잘못 선발되는 유전자형들은 mmAA, mmAa, mmAa 이므로 따라서 error rate는 c(2-c) 나. Dominant allele ‘A’를 간접 선발할 경우에도 마찬가지 error rate는 c(2-c)
(2) Marker assisted backcrossing Foregroundselection Backgroundselection
가. Single marker selection Recurr. p. MmAa Mmaa mmAa mmaa MmAa x mmaa M을 선발하면 MmAa Mmaa (error) error rate는 c : M을선발했는데 aa 가 선발될 확률임. 만일 조환가(c)가 0.1이라면 errorrate는 10% 나. Selection using flankingmarkers 연관정도 : : 1-cA : 1-cB MA1 MB1 - Q1 - Q1 Donor p. Recurr. p. Q2Q2 MB2MB2 MA1 MA1 MA1 MA1 Q1 Q1 Q1 Q1 MB1 MB1 MB1 MB1 MA2MA2 Q1Q2 MB1MB2 MA1MA2 BCF1에서 8개의 genotypes + 선발마커 allele 이 선발되기를 희망 Q1Q2 MA1MA2 MB1MB2
두개의 마커를 동시에 선발대상으로 할 때 Errorrate는 Genotypes and frequency in BC1F1 Kinds of F1 gametes Frequency Gametes of the recurrent p. Frequency Q1 MB1 MA1 Q1 Q1 MB1 MB1 MA1 (1-cB) 1/2(1-cA ) MA1 MA1 Q1 MB1 (1-cB) 1/2(1-cA ) Q1 MB2 MA1 Q1 Q1 MB1 MB2 cB MA1 (1-cA ) MA1 cB 1/2 (1-cA ) 1/2 MA1 cB Q2 MB1 cA cB 1/2 cA MA1 Q1 Q2 MB1 MB1 1/2 MA1 1/2 cA (1-cB) 1/2 cA (1-cB) MA1 Q1 Q2 MB1 MB2 MA1 MA1 Q2 MB2 1/2 cA (1-cB) 1/2 cA Q1 MB1 (1-cB) MA2 MA2 Q1 Q1 MB1 MB1 MA1 1/2 cA cB 1/2 cA cB Error Q1 MB2 MA2 MA2 Q1 Q1 MB1 MB2 MA1 cB Q2 MB1 (1-cA ) 1/2 cB MA2 (1-cA ) 1/2 MA2 Q1 Q2 MB1 MB1 MA1 Q2 MB2 MA2 1/2 (1-cB) (1-cA ) MA2 Q1 Q2 MB1 MB2 1/2 (1-cB) (1-cA ) MA1 1 Total 1 1/2 cA cB cA cB = Error rate = +1/2 (1-cB) + 2 1/2 cA cB (1-cA ) 1-cA -cB cA cB 만일 c=0.1이면 error = 0.012 즉 1.2% 1개의 마커 선발시보다 훨씬 error 적음.
4. MAS – examples (rice) (1) Breeding for submergence tolerance at IRRI (Mackill, 2010) • David Mackill, Reycel Mighirang-Rodrigez, Varoy Pamplona, CN Neeraja, Sigrid Heuer, Iftekhar Khandakar, Darlene Sanchez, Endang Septiningsih & Abdel Ismail 27/52
A major QTL on chrom. 9 for submergence tolerance – Sub1 QTL Segregation in an F3 population Xu and Mackill (1996) Mol Breed 2: 219 (Mackill, 2010) 29/52
Make the backcrosses X Swarna Popular variety IR49830 Sub1 donor F1 X Swarna BC1F1 30/52
Collect the leaf samples of BC1F1 plants - 10 days after transplanting for marker analysis Genotyping to select the BC1F1 plants with a desired character for crosses 31/52
Selection for Swarna+Sub1 (Mackill, 2010) Swarna/ IR49830 F1 Swarna X Plant #242 376 had Sub1 21 recombinant Select plant with fewest donor alleles BC1F1 697 plants Swarna X BC2F1 320 plants BC2F2 937 plants Plants #246 and #81 158 had Sub1 5 recombinant Swarna X Plant #227 Plant 237 BC2F2 BC3F1 18 plants 1 plant Sub1 with 2 donor segments 32/52
Swarna with Sub1 33/52
Graphical genotype of Swarna-Sub1 BC3F2 line Approximately 2.9 MB of donor DNA 34/52
(2) Breeding ‘Anmibyeo’ ,resistant to Brownplanthopper, through MAS 식량과학원 Junam IR65482-7-216-1-2 (Bph18) P1: Junam (S) P2: IR65482 (R) P2 P1 S.523P2 P1 2002 Winter F1Junam P1 P2 2003 BC1F1Junam MAS+PS Resist. plants Susceptible plants BC2F1 Junam 2003 Winter MAS BC3F1 2004 MAS+PS 2004-2006 Selfing BC3F6 2007-2008 Yield trial 2008-2010 Regional yield trial S. 523 (BC2F7-9) PS: phenotypic selection Anmibyeo(2010) (YC Cho, NICS, 2011) 35/52
(3) Heterosis prediction at SNU F1 잡종품종 육성 과정 분리집단 순환선발, 자식… 조합능력검정 근교계 육성 F1종자 대량생산체계 도입 (ms, SI 등) 포장평가 양친간 유전거리 조합능력 평가 잡종양친선정 품종화 36/52
벼 10개 품종간 이면교배 F1 F1 수량검정 (잡종강세평가) 양친간 모든마커이용 유전거리 측정 상관 (A,D,G) (A) (D) (G) r=-0.155ns r=-0.043ns r=-0.412** F1 수량검정 (잡종강세평가) 양친간 유의한마커이용 유전거리 측정 상관 (B,E,H) (B) (E) (H) r=-0.668** r=-0.692** r=-0.640** GS estimates based on 10 HV SSR primers 37/52
Relative proportion of markers to each group In this study Unselected Selected Correlation coefficients between heterosis and GSs SSR RAPD -1 Association test of each marker with heterosis 22 (29.7 %) 13 (8.3 %) HVmarkers Key markers Entire set of markers 49 (66.2 %) 133 (84.7 %) 0 N markers 3 (4.1 %) 11 (7.0 %) HW markers +1 74 (100 %) 157 (100 %) Total No. of polymorphic markers In this study A schematic diagram of the key marker concept for predicting heterosis through correlation analysis between heterosis and estimates of GS based on markers and relative proportion of markers to each group in this study (HV: associated with hybrid vigor, N (neutral): not associated with heterosis, and HW: associated with hybrid weakness) (Breeding Science 54: 389-397(2004)) 38/52
(4) Model equations for evaluating japonica rice taste containing the significant coefficient of each marker t value aided by multiple regression analysis