Download
1 / 24
240 likes | 257 Vues
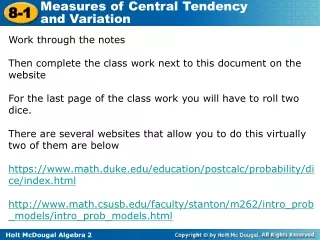
Work through the notes Then complete the class work next to this document on the website For the last page of the class work you will have to roll two dice. There are several websites that allow you to do this virtually two of them are below

E N D
Work through the notes Then complete the class work next to this document on the website For the last page of the class work you will have to roll two dice. There are several websites that allow you to do this virtually two of them are below https://www.math.duke.edu/education/postcalc/probability/dice/index.html http://www.math.csusb.edu/faculty/stanton/m262/intro_prob_models/intro_prob_models.html
Objectives Find measures of central tendency and measures of variation for statistical data. Examine the effects of outliers on statistical data.
Vocabulary expected value probability distribution variance standard deviation outlier
The mean is the sum of the values in the set divided by the number of values. It is often represented as x. The median is the middle value or the mean of the two middle values when the set is ordered numerically. The mode is the value or values that occur most often. A data set may have one mode, no mode, or several modes. Recall that the mean, median, and mode are measures of central tendency—values that describe the center of a data set.
deer Example 1: Finding Measures of Central Tendency Find the mean, median, and mode of the data. deer at a feeder each hour: 3, 0, 2, 0, 1, 2, 4 Mean: Median: 0 0 1 2 2 3 4 = 2 deer Mode: The most common results are 0 and 2.
Check It Out! Example 1a Find the mean, median, and mode of the data set. {6, 9, 3, 8} Mean: Median: 3 6 8 9 Mode: None
Check It Out! Example 1b Find the mean, median, and mode of the data set. {2, 5, 6, 2, 6} Mean: Median: 2 2 5 6 6 = 5 Mode: 2 and 6
A weighted average is a mean calculated by using frequencies of data values. Suppose that 30 movies are rated as follows: weighted average of stars =
For numerical data, the weighted average of all of those outcomes is called the expected valuefor that experiment. The probability distributionfor an experiment is the function that pairs each outcome with its probability.
Example 2: Finding Expected Value The probability distribution of successful free throws for a practice set is given below. Find the expected number of successes for one set.
Example 2 Continued Use the weighted average. Simplify. The expected number of successful free throws is 2.05.
Check It Out! Example 2 The probability distribution of the number of accidents in a week at an intersection, based on past data, is given below. Find the expected number of accidents for one week. Use the weighted average. expected value = 0(0.75) + 1(0.15) + 2(0.08) + 3(0.02) = 0.37 Simplify. The expected number of accidents is 0.37.
A box-and-whisker plot shows the spread of a data set. It displays 5 key points: the minimumand maximumvalues, the median, and the firstand third quartiles.
The quartiles are the medians of the lower and upper halves of the data set. If there are an odd number of data values, do not include the median in either half. The interquartile range, or IQR, is the difference between the 1st and 3rd quartiles, or Q3 – Q1. It represents the middle 50% of the data.
Example 3: Making a Box-and-Whisker Plot and Finding the Interquartile Range Make a box-and-whisker plot of the data. Find the interquartile range. {6, 8, 7, 5, 10, 6, 9, 8, 4} Step 1 Order the data from least to greatest. 4, 5, 6, 6, 7, 8, 8, 9, 10 Step 2 Find the minimum, maximum, median, and quartiles. 4, 5, 6, 6, 7, 8, 8, 9, 10 Mimimum Median Maximum Third quartile 8.5 First quartile 5.5
Example 3 Continued Step 3 Draw a box-and-whisker plot. Draw a number line, and plot a point above each of the five values. Then draw a box from the first quartile to the third quartile with a line segment through the median. Draw whiskers from the box to the minimum and maximum.
Example 3 Continued IRQ = 8.5 – 5.5 = 3 The interquartile range is 3, the length of the box in the diagram.
Check It Out! Example 3 Make a box-and-whisker plot of the data. Find the interquartile range. {13, 14, 18, 13, 12, 17, 15, 12, 13, 19, 11, 14, 14, 18, 22, 23} Step 1 Order the data from least to greatest. 11, 12, 12, 13, 13, 13, 14, 14, 14, 15, 17, 18, 18, 19, 22, 23 Step 2 Find the minimum, maximum, median, and quartiles. 11, 12, 12, 13, 13, 13, 14, 14, 14, 15, 17, 18, 18, 19, 22, 23 Mimimum Median Maximum First quartile 13 Third quartile 18
Check It Out! Example 3 Continued Step 3 Draw a box-and-whisker plot. IQR = 18 – 13 = 5 The interquartile range is 5, the length of the box in the diagram.
Example 1: Wildlife Application A researcher is gathering information on the gender of prairie dogs at a wildlife preserve. The researcher samples the population by catching 10 animals at a time, recording their genders, and releasing them.
Since there were 24 males in the sample, and 16 females, he estimates that the ratio of males tofemales is 3:2. ContinuedExample 1: Wildlife Application How can he use this data to estimate the ratio of males to females in the population?
Check It Out! Example 1 Identify the population and the sample. 1. A car factory just manufactured a load of 6,000 cars. The quality control team randomly chooses 60 cars and tests the air conditioners. They discover that 2 of the air conditioners do not work. population: 6,000 total cars sample: 60 cars
Example 2A: Identifying Potentially Biased Samples Decide whether each sampling method could result in a biased sample. Explain your reasoning. A. A survey of a city’s residents is conducted by asking 20 randomly selected people at a grocery store whether the city should impose a beverage tax. Residents who do not shop at the store are underrepresented, so the sample is biased.
Example 2B: Identifying Potentially Biased Samples B. A survey of students at a school is conducted by asking 30 randomly selected students in an all-school assembly whether they walk, drive, or take the bus to school. No group is overrepresented or underrepresented, so the sample is not likely to be biased.