Download
1 / 46
460 likes | 481 Vues
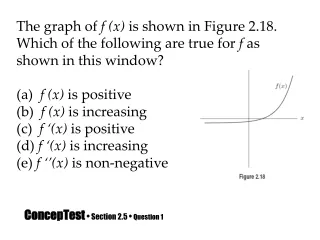
The graph of f (x) is shown in Figure 2.18. Which of the following are true for f as shown in this window? (a) f (x) is positive f (x) is increasing f ‘(x) is positive f ‘(x) is increasing f ‘’(x) is non-negative. ConcepTest • Section 2.5 • Question 1. ANSWER.

E N D
The graph of f (x) is shown in Figure 2.18. Which of the following are true for f as shown in this window? (a) f (x) is positive • f (x) is increasing • f ‘(x) is positive • f ‘(x) is increasing • f ‘’(x) is non-negative ConcepTest• Section 2.5 •Question 1
ANSWER ConcepTest• Section 2.5 •Answer 1 (b), (c), (d), and (e) COMMENT: You could repeat this problem with other graphs.
If f ‘(x) is positive, then f ‘’(x) is increasing. (a) True (b) False ConcepTest• Section 2.5 •Question 2
ANSWER ConcepTest• Section 2.5 •Answer 2 (b). f ‘(x) positive means f (x) is increasing. f ‘(x) = x4 – 8x2 + 18 provides a counterexample. COMMENT: Have students provide their own counterexample. You might also phrase this question in terms of concavity and give graphical counterexamples.
If f ‘(x) is increasing, then f (x) is increasing. (a) True (b) False ConcepTest• Section 2.5 •Question 4
ANSWER ConcepTest• Section 2.5 •Answer 3 (b). If f ‘(x) is increasing, then the only acceptable conclusion is that f (x) is concave up. For an example, consider f ‘(x) = 2x, then a possibility for f (x) is x2 which is not always increasing. COMMENT: Have students provide their own counterexample. You might also phrase this question in terms of concavity and give graphical examples.
If f ‘‘(x) is positive, then f (x) is concave up. (a) True (b) False ConcepTest• Section 2.5 •Question 4
ANSWER ConcepTest• Section 2.5 •Answer 4 (a) COMMENT: You could ask what is true if f ‘’(x) < 0.
If f ‘‘(x) is positive, then f ‘(x) is increasing. (a) True (b) False ConcepTest• Section 2.5 •Question 5
ANSWER ConcepTest• Section 2.5 •Answer 5 (a) COMMENT: You might note that f ‘’(x) is the rate of change of f ‘(x).
If f ‘(x) is increasing, then f (x) is concave up. (a) True (b) False ConcepTest• Section 2.5 •Question 6
ANSWER ConcepTest• Section 2.5 •Answer 6 (a) COMMENT: You might note that f ‘(x) increasing means f ‘‘(x) is positive.
If the velocity of an object is constant, then its acceleration is zero. (a) True (b) False ConcepTest• Section 2.5 •Question 7
ANSWER ConcepTest• Section 2.5 •Answer 7 (a) COMMENT: Follow-up Question. If the velocity is zero at a specific instant in time, does the acceleration need to be zero at that same time also? Answer. No, a grapefruit that is tossed straight up in the air has a velocity of 0 ft/sec when the grapefruit reaches the highest point it will travel. However, at that point the acceleration of the grapefruit is that of gravity, which is not 0 ft/sec2.
The value of the second derivative of the function shown in Figure 2.19 at the point x = 1 is (a) Positive (b) Negative ConcepTest• Section 2.5 •Question 8
ANSWER ConcepTest• Section 2.5 •Answer 8 (b). As x increases, the slope of the tangent line decreases. Thus the second derivative is not positive. COMMENT: You could ask students if the magnitude of the second derivative of a function can be determined from the graph of the function. It cannot. For example, consider the function f (x) = x2. It looks almost straight in places, i.e. no concavity, which would imply that the second derivative is zero. But, the value of the second derivative is always 2.
In Figure 2.20, the second derivative at points a, b, and c is (respectively) (a) +, 0, – (b) –, 0, + (c) –, 0, – (d) +, 0, + (e) +, +, – (f) –, –, + ConcepTest• Section 2.5 •Question 9
ANSWER ConcepTest• Section 2.5 •Answer 9 (b). The graph is concave down at a, so f ‘’(a) ≤ 0 leaving (b), (c), and (f). The graph is concave up at c, so f ‘’(c) ≥ 0 leaving (b) and (f). The graph has an inflection point at b, so f ‘’(b) = 0 leaving (b). COMMENT: See Problem 8.
In Figure 2.21, the second derivative at points a, b, and c is (respectively) (a) +, 0, – (b) –, 0, + (c) –, 0, – (d) +, 0, + (e) 0, +, 0 (f) 0, –, 0 ConcepTest• Section 2.5 •Question 9
ANSWER ConcepTest• Section 2.5 •Answer 10 (b). The graph is concave down at a, so f ‘’(a) ≤ 0 leaving (b), (c), (e), and (f). The graph is concave up at c, so f ‘’(c) ≥ 0 leaving (b), (e), and (f). The graph has an inflection point at b, so f ‘’(b) = 0 leaving (b). COMMENT: See Problem 8.
In Figure 2.22, at x = 0 the signs of the function and the first and second derivatives, in order, are (a) +, 0, – (b) +, 0, – (c) –, +, – (d) –, +, + (e) +, –, + (f) +, +, + ConcepTest• Section 2.5 •Question 11
ANSWER ConcepTest• Section 2.5 •Answer 11 (b). At x = 0 the graph is positive, has a horizontal tangent, and is concave down. COMMENT: See Problem 8.
In Figure 2.23, at x = 0 the signs of the function and the first and second derivatives, in order, are (a) –, +, + (b) –, –, – (c) –, +, – (d) –, +, + (e) +, –, + (f) +, +, + ConcepTest• Section 2.5 •Question 12
ANSWER ConcepTest• Section 2.5 •Answer 12 (e). At x = 0 the graph is positive, decreasing, and concave up. COMMENT: See Problem 8.
In Figure 2.24, at x = 0 the signs of the function and the first and second derivatives, in order, are (a) +, 0, + (b) –, 0, – (c) +, 0, – (d) –, +, 0 (e) +, –, 0 (f) +, +, + ConcepTest• Section 2.5 •Question 13
ANSWER ConcepTest• Section 2.5 •Answer 13 (d). At x = 0 the graph is negative, increasing, and has an inflection point. COMMENT: See Problem 8.
Which of the following graphs (a)-(d) could represent the second derivative of the function in Figure 2.25? ConcepTest• Section 2.5 •Question 14
ANSWER ConcepTest• Section 2.5 •Answer 14 (d). The graph in Figure 2.25 is concave up for x < –1.2 and x > 0.5 with inflection points at x ≈ –1.2 and 0.5. It is concave down elsewhere. So the second derivative is positive for x < –1.2 and x > 0.5, negative for –1.2 < x < 0.5, and zero at x ≈ –1.2 and 0.5. COMMENT: You could have students explain why (a), (b), and (c) fail to be the correct answer.
Which of the following graphs (a)-(d) could represent the second derivative of the function in Figure 2.26? ConcepTest• Section 2.5 •Question 15
ANSWER ConcepTest• Section 2.5 •Answer 15 (b). The graph in Figure 2.26 appears to be concave down for –2 < x < –0.7 and 0 < x < 0.7. It is concave up elsewhere with inflection points at x ≈ –0.7, 0, and 0.7. COMMENT: You could have students explain why (a), (c), and (d) fail to be the correct answer.
Figure 2.27 shows position as a function of time for two sprinters running in parallel lanes. Which of the following is true? ConcepTest• Section 2.5 •Question 16 • At time A, both sprinters have the same velocity. • Both sprinters continually increase their velocity. • Both sprinters run at the same velocity at some time before A. • At some time before A, both sprinters have the same acceleration.
ANSWER ConcepTest• Section 2.5 •Answer 16 (c). The sprinter whose position is given by (I) has a constant velocity, represented by the slope of the line. Since the slope of the curve (II) continually decreases, the velocity of the sprinter is continually decreasing. At A both sprinters have the same position. The acceleration for sprinter (I) is zero, so the only true statement is (c). They have the same velocity when the slope of curve (II) is parallel with the line (I). COMMENT: You might point out the relationship between this problem and the Mean Value Theorem.
If an object’s acceleration is negative, at that particular instant the object can be (a) Slowing down only (b) Speeding up only (c) Slowing down or momentarily stopped only (d) Slowing down, momentarily stopped, or speeding up ConcepTest• Section 2.5 •Question 17
ANSWER ConcepTest• Section 2.5 •Answer 17 (d). The acceleration of an object is the rate of change of its velocity with respect to time. If the acceleration is negative, its velocity is decreasing, but this tells us nothing about the value of the velocity. COMMENT: You could have students provide position graphs of an object with negative acceleration which satisfies (a), (b), and (c), respectively.
Figure 2.28 shows the graph of position versus time, t. Which of (a)-(d) represents a corresponding graph of acceleration as a function of time? ConcepTest• Section 2.5 •Question 18
ANSWER ConcepTest• Section 2.5 •Answer 18 (b). The position graph is concave down for 0 < t < 4. Thus the acceleration is not positive for 0 < t < 4. COMMENT: You could have students give specific points on the graphs of the other choices which have properties that are not consistent with Figure 2.28.
Figure 2.29 shows the graph of position versus time, t. Which of (a)-(d) represents a corresponding graph of acceleration as a function of time? ConcepTest• Section 2.5 •Question 19
ANSWER ConcepTest• Section 2.5 •Answer 19 (d). The graph appears to be concave down for 0 < t < 2, concave up for 2 < t < 4 with an inflection point at t = 2. Thus the acceleration is not positive for 0 < t < 2, is not negative for 2 < t < 4, and is zero at t = 2. COMMENT: You could have students give specific points on the graphs of the other choices which have properties that are not consistent with Figure 2.29.
Figure 2.30 represents acceleration as a function of time, t. Which of the following could represent the corresponding position versus time graph? • (I) • (II) • (III) • (I) and (II) • (I), (II), and (III) • None of these ConcepTest• Section 2.5 •Question 20
ANSWER ConcepTest• Section 2.5 •Answer 20 (e). From Figure 2.30 we notice that the graph of the position function is concave up for 0 < t < 1, is concave down for 1 < t < 5, and has an inflection point when t = 1. Since the graphs shown in (I), (II), and (III) have these properties, then each could be a possible graph of the position function. COMMENT: You might point out that the graphs in (I) and (II) differ by a vertical translation.
At a specific instant in time, the radius of the universe was observed to be increasing. The second derivative of the radius with respect to time is known to be always negative. Which of the following is true? • The universe will keep expanding forever. • At some point in the future the universe will stop expanding and begin contracting. • With the given information either of these is a possibility. ConcepTest• Section 2.5 •Question 21
ANSWER ConcepTest• Section 2.5 •Answer 21 (c). A negative second derivation is possible for functions which are either increasing or decreasing. COMMENT: Follow-up Question. What if we know the radius was always increasing. Would that change the answer? Answer. Yes, with the additional information we know that the first derivative is always positive. Therefore (a) is now correct. However, it does not say the radius grows without bound. It may approach an asymptotic value.
In Star Trek: First Contact, Worf almost gets knocked into space by the Borg. Assume he was knocked into space and his space suit was equipped with thrusters. Worf fires his thruster for 1 second which produces a constant acceleration in the positive direction. In the next second he turns off his thrusters. In the third second he fires his thrusters producing a constant negative acceleration. The acceleration as a function of time is given in Figure 2.31. Which of (a)-(d) represent his position versus time graph? ConcepTest• Section 2.5 •Question 22
ANSWER ConcepTest• Section 2.5 •Answer 22 (c). From the acceleration graph we see that the position graph will be concave up for 0 < t < 1, concave down for 2 < t < 3 and have a constant slope for 1 < t < 2. COMMENT: You could have students give specific points on the graphs in the other choices which have properties not consistent with the given acceleration graph.
Which of the following graphs satisfies the relationship f ‘’(x) = – f (x)? ConcepTest• Section 2.5 •Question 23
ANSWER ConcepTest• Section 2.5 •Answer 23 (a). Functions that satisfy f ‘’(x) = – f (x) will be concave down where the function is positive and concave up where it is negative. Inflection points occur where the function is zero. The answer (c) would also be correct if we could tell that inflection points occurred at x = 2. COMMENT: You could have students give specific points on the graphs in the other choices which have properties not consistent with the fact that f ‘’(x) = – f (x).