Analysis and Application of EMG data
Analysis and Application of EMG data. Henri Pihkala 27.2.2007. About the literature survey. Motivation: how to use the EMG data is essential information for the course project work I tried to make the survey very ”stand-alone” in nature for two reasons:

Analysis and Application of EMG data
E N D
Presentation Transcript
Analysis and Application of EMG data Henri Pihkala 27.2.2007
About the literature survey • Motivation: how to use the EMG data is essential information for the course project work • I tried to make the survey very ”stand-alone” in nature for two reasons: • To more closely mimic the sctructure and spirit of a real scientific article, for good practice • Commenting on aspects of the project work throughout the article would make it harder to read • So the project work is discussed in the conclusions, but in this presentation we can talk about it more freely
To understand EMG data and make use of it, we must: • Understand what is EMG (-data) • Understand what factors affect the signal • Understand the characteristics of the signal and know how to process it into usable form • Understand the possibilities and limitations of what can be made of it
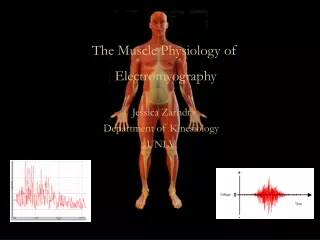
What is EMG? • EMG or electromyography is a technique for detecting and recording electrical signals emanated by muscles when activated.[1] • EMG data is the time series recording of these signals. • Do we need to look deeper into it in order to understand the nature of EMG data? • Yes, of course, but only only enough to understand the principle of how the signal is generated.
Quick biological background • A nerve impulse triggers an action potential on the muscle cell membrane • These action potentials move along the muscle fiber and pass an electrode, which records the moving potential difference as a bipolar wave[1]. • See illustration on next page
How the electrode sees the moving action potential. Image taken from [1].
What is EMG? • The EMG signal is a superposition of all the action potentials detected at the electrode as bipolar signals • Important: for biological reasons the firing of action potentials is random, so there is inherent randomness in the signal. • Nonetheless, the greater the contraction, the more there are action potentials, and the greater is the general voltage (amplitude) read by the sensor.[1]
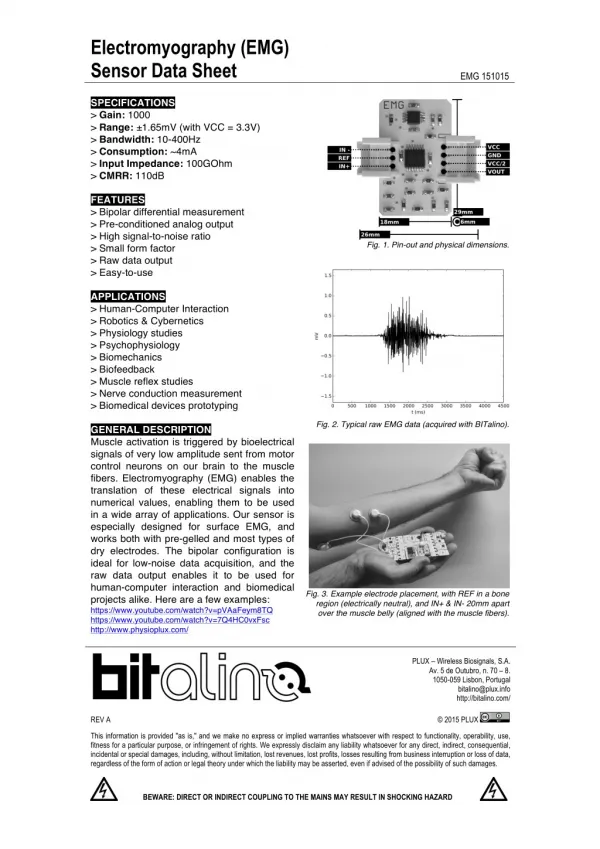
Raw EMG data • Raw EMG data is time series data obtained from the voltage seen by the electrode by means of sampling and A/D conversion. • "Raw EMG offers us valuable information in a particularly useless form".[6] • However it is the basis for all processing and applications. • See illustration on next page.
An illustration of the raw EMG signal. Image taken from [1].
What is the EMG data like? • As mentioned, the greater the contraction of the muscle, the larger the amplitude (on average, as there is lots of random variation) • Raw surface EMG signal voltage ranges between +/- 5,000 microvolts on frequencies typically between 6 and 500 Hz.[1] • So the sampling rate should be at least 1,000 Hz, according to the Nyquist theorem.[2]
What is the EMG data like? • It is not clean: • Inherent randomness • Muscle cross talk • Tissue characteristics and measurement conditions affect the scale of the amplitude! • Movement of the muscle relative to the electrode site (with skin surface electrodes) • Easily picks up heartbeat artifacts • Sensitive equipment easily picks up external problems such as interfering power hum
What is the EMG data like? • Needs to be cleaned before use • One needs to acknowledge the limitations set by the combination of factors affecting the signal • Next we will look at a few standard preprocessing methods, which will help make sensible use of the signal.
Rectification • Because the signal is (or should be) zero-mean, something should be done to be able to calculate useful average values and amplitude parameters. [1],[5] • (Full wave) rectification means that each value is replaced by its absolute value, see image:
Rectification Full wave rectification. Image taken from [1].
Smoothing • The idea of smoothing is to reduce the inherent randomness present in the signal. This levels the sharp peaks in the rectified signal and helps considerably in displaying trends and signal development • RMS (root mean square), moving average, integration and low-pass filtering are the most common algorithms used for smoothing.[1],[5] • RMS is often considered to be the standard method.[5]
Smoothing Effects of smoothing. Image taken from [1].
Normalization / calibration • Because the measurement conditions affect the signal amplitude, it is unquantifiable as is. • The signal needs to be scaled on the voltage axis with reference to some value with physiological relevance. • The most popular method is maximum voluntary contraction (MVC) method.[1],[5]
Interpretation • What kind of information is extractable from the EMG data, and what isn't? • The data can be viewed in the time-amplitude domain or transformed – for example to the frequency domain
Amplitude parameters • The amplitude of the (smoothed) signal is proportional to the amount of contraction in the muscle. • Mean, peak value etc. • However the values are not comparable without normalization, as discussed before • The muscle on/off question is easy to answer • Just don't interpret baseline noise or other artifacts as muscle activity.[1],[5]
Amplitude parameters • Harder questions are more difficult to answer:[1] • What is the activation percentage of the muscle? • Needs normalization • What is the force output of the muscle? • It seems natural to think that the amount of contraction in a muscle is closely related to the amount of force applied by the muscle. • This is true, but the relationship is not simple, as it varies between different muscles and subjects, ranging from types of curvilinear to linear.[1] [6] • In practice impossible to determine from EMG data only
Time parameters • As the muscle on/off activation can be determined, we can also look at the time and duration of muscle activation • Access to muscle firing sequences in, for example, motion studies and ergonomics • Other parameters include time-to-peak value • How quickly a muscle can reach its maximum contraction • Of biological interest
Frequency parameters • The EMG data contains valuable information also in the frequency domain, which is most commonly accessed by means of Fast Fourier Transform (FFT)[6], which reveals the power spectrum of the signal in the selected time window. • From the spectrum, dominant frequencies can be observed, as well as the power at interesting frequencies. • Fatigue studies, for example, use frequency analysis to observe time-domain changes in peak frequencies when the muscle fatigues.[1]
Frequency parameters • The major drawback of the Fourier transform techniques is that they assume the signal to be stationary, which the EMG signal is not. • Better time-frequency analysis methods are available.[6]
Advanced methods • Often the information obtainable by analysis in the time-amplitude or frequency domains are not enough for the given application. • For example, one might want to decompose the EMG signal in pursuit of the original motor unit action potentials. • Wavelet transforms, principal component analysis... [6]
Advanced methods • Measurements from just one muscle can be used for a limited number of things • Studying activation patterns opens many possibilities, but makes the problem much more complex • Artificial neural networks, fuzzy logic systems...[6] • For example, EMG and pattern recognition algorithms have been used for gesture recognition in a man-machine interface scenario. [7]
Advanced methods • The advanced methods are complex and I will not go into details here • Literature is available on the methods themselves as well as their uses on EMG, please see [6].
Conclusions • Basic muscle on/off with timing is easy • Changes in muscle activation level can be observed, but any amplitude parameters are not comparable between subjects or measurements unless normalization is used • Frequency domain contains some information, but analysis is complicated by the non-stationary nature of the EMG signal • Inferences outside these basic things require application and knowledge of advanced tools
Conclusions with the project work in mind • For a ball-throwing game, amplitude and time parameters can and need to be used, while the frequency domain offers nothing • Actual force with which the ball is thrown can not be established, but a close-enough approximative model can most likely be built to make the game enjoyable • The first step is to use EMG to examine which muscles are involved in throwing a ball at variable speeds and to find the features of the signal that determine the speed
Conclusions for the project work in mind • The features might be obvious just by looking at the signal • Or, if the throwing of a ball turns out to be a complex operation muscle-wise, perhaps good modeling tools such as neural networks can be of use • We might need to do amplitude calibration – how to integrate it into the game so that a child can do it (without getting bored)?
References • [1] Konrad, Peter (2005). The ABC of EMG Version 1.0. Noraxon U.S.A. Inc., 4-9. • [2] Nyquist, Harry (1928). "Certain Topics in Telegraph Transmission Theory". Transactions of the A.I.E.E., 617-644, New York, NY: American Institute of Electrical Engineers. • [5] Soderberg, Gary L.; Knutson, L. (2000). "A Guide for Use and Interpretation of Kinesiologic Electromyographic Data". Physical Therapy 80 (5): 485-498.
References • [6] Reaz, M. B .I.; Hussain, Mohd-Yasin (2006). Techniques of EMG signal analysis: detection, processing, classification and applications. Biological Procedures Online. http://76.162.25.80/bpo/arts/1/115/m115.htm Retrieved on 26.2.2007. • [7] Putnam, William; Knapp, R. Benjamin (1993). The Use of The Electromyogram in a Man-Machine Interface Scenario. California State University Northridge. http://www.csun.edu/cod/conf/1993/proceedings/Elect~1.htmRetrieved on 26.2.2007.