Computational methods to inferring cellular networks
Computational methods to inferring cellular networks. Stat 877 Apr 15 th 2014 Sushmita Roy. Goals for today. Introduction Different types of cellular networks Methods for network reconstruction from expression Per- gene vs Per-module methods Sparse Candidates Bayesian networks

Computational methods to inferring cellular networks
E N D
Presentation Transcript
Computational methods to inferring cellular networks Stat 877 Apr 15th 2014 Sushmita Roy
Goals for today • Introduction • Different types of cellular networks • Methods for network reconstruction from expression • Per-gene vs Per-module methods • Sparse Candidates Bayesian networks • Regression-based methods • GENIE3 • L1-DAG learn • Assessing confidence in network structure
Why networks? “A system is an entity that maintains its function through the interaction of its parts” • Kohl & Noble
To understand cells as systems: measure, model, predict, refine Uwe Sauer, Matthias Heinemann, Nicola Zamboni, Science 2007
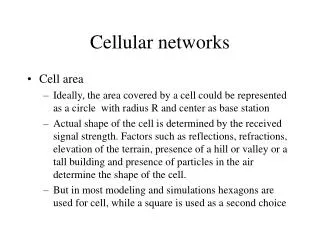
Different types of networks • Physical networks • Transcriptional regulatory networks: interactions between regulatory proteins (transcription factors) and genes • Protein-protein: interactions among proteins • Signaling networks: protein-protein and protein-small molecule interactions to relay signals from outside the cell to the nucleus • Functional networks • Metabolic: reactions through which enzymes convert substrates to products • Genetic: interactions among genes which when perturbed together produce a significant phenotype than when individually perturbed
Transcriptional regulatory networks Transcription factors (TF) A B DNA Gene C B A C • Directed, signed, weighted graph • Nodes: TFs and Target genes • Edges: A regulates B’s expression level Regulatory network of E. coli. 153 TFs (green & light red), 1319 targets Vargas and Santillan, 2008
Metabolic networks M Enzymes b N Metabolites c a O d N M O • Unweighted graph • Nodes: Metabolic enzyme • Edges: Enzymes M and N share a compound Reactions associated with Galactose metabolism KEGG
Protein-protein interaction networks Y X X Y • Un/weighted graph • Nodes: Proteins • Edges: Protein X physically interacts with protein Y Yeast protein interaction network Barabasi et al. 2003
Challenges in network biology Identifying edges and their logic A B X=f(A,B) Network reconstruction/inference (today) 1 ? ? ? Y=g(B) Node attributes Parameters Structure X X B A A Network structure analysis 2 Hubs, degree-distributions, Network motifs Y Y f Network applications Predicting function and activity of genes from network 3 f ? g
Goals for today • Introduction • Different types of cellular networks • Methods for network reconstruction from expression • Per-gene vs Per-module methods • Sparse Candidates Bayesian networks • Regression-based methods • GENIE3 • L1-DAG learn • Assessing confidence in network structure
Computational methods to infer networks • We will focus on transcriptional regulatory networks • These networks control what genes get activated when • Precise gene activation or inactivation is crucial for many biological processes • Microarrays and RNA-seq allows us to systematically measure gene activity levels • These networks are primarily inferred from gene expression data
What do we want a model to capture? Input: Transcription factor level (trans) Sko1 Hot1 HSP12 Output: expression levels X2 X1 Hot1 Sko1 BOOLEAN LINEAR DIFF. EQNS PROBABILISTIC …. Hot1 regulates HSP12 X3=ψ(X1,X2) HSP12 is a target of Hot1 HSP12 X3 Output: mRNA levels Function Structure Who are the regulators? How they determine expression levels?
Mathematical representations of regulatory networks X1 X2 Input expression/activity of regulators Models differ in the function that maps regulator input levels to target levels f X3 Output expression of target gene Boolean Networks Differential equations Probabilistic graphical models Probability distributions Rate equations Input Output X1 X2 X3
Regulatory network inference from expression Experiments X2 X1 Structure X1 X2 Genes Expression-based network inference X3=f(X1,X2) X3 X3 Expression level of gene i in experiment j Function
Two classes of expression-based methods • Per-gene/direct methods (Today) • Module based methods (Thursday) X1 X2 X3 X4 X1 X2 X5 X3 Module X3 X5
Per-gene methods • Key idea: find the regulators that “best explain” expression level of a gene • Probabilistic graphical methods • Bayesian network • Sparse Candidates • Dependency networks • GENIE3, TIGRESS • Information theoretic methods • Context Likelihood of relatedness • ARACNE X3 X4 X1 X2 X5 X3
Module-based methods • Find regulators for an entire module • Assume genes in the same module have the same regulators • Module Networks (Segal et al. 2005) • Stochastic LeMoNe (Joshi et al. 2008) X1 X2 Module Y1 Y2 Per module
Goals for today • Introduction • Different types of cellular networks • Methods for network reconstruction from expression • Per-gene vs Per-module methods • Sparse Candidates Bayesian networks • Regression-based methods • GENIE3 • L1-DAG learn • Assessing confidence in network structure
Notation • V: A set of pnetwork components • pgenes • E: Edge set connecting V • G=(V, E). Gis the graph we wish to infer • Xv: Random variable, for vεV • X={X1,.., Xp} • D: Dataset of N measurements for X • D: {x1,…xN} • Θ: Set of parameters associated with the network Spang and Markowetz, BMC Bioinformatics 2005
Bayesian networks (BN) • Denoted by B={G, Θ} • G: Graph is directed and acyclic (DAG) • Pa(Xi): Parents of Xi • Θ: {θ1,.., θp} Parameters for p conditional probability distributions (CPD) P(Xi| Pa(Xi)) • Vertices of Gcorrespond to random variables X1… Xp • Edges of Gencode directed influences between X1… Xp
A simple Bayesian network of four variables Random variables: Cloudy ε {T, F} Sprinkerε {T, F} Rain ε {T, F} WetGrassε {T,F} Adapted from “Introduction to graphical models”, Kevin Murphy, 2001
A simple Bayesian network of four variables Random variables: Cloudy ε {T, F} Sprinkerε {T, F} Rain ε {T, F} WetGrassε {T,F} Conditional probability distributions (CPD) Adapted from “Introduction to graphical models”, Kevin Murphy, 2001
Bayesian network representation of a regulatory network Sko1 Hot1 HSP12 Inside the cell Regulators (Parents) X1 Hot1: X2 X1 P(X1) P(X2) X2 Random variables Sko1: P(X3|X1,X2) X3 Target (child) X3 Hsp12: Bayesian network
Example Bayesian network of 5 variables Parents X2 X1 X4 X3 Child X5 Assume Xi is binary Needs 25 measurements No independence assertions Needs 23 measurements Independence assertions
CPD in Bayesian networks • The CPD P(Xi|Pa(Xi)) specifies a distribution over values of Xi for each combination of values of Pa(Xi) • CPD P(Xi|Pa(Xi)) can be parameterized in different ways • Xiare discrete random variables • Conditional probability table or tree • Xiare continuous random variables • CPD can be Gaussians or regression trees
Representing CPDs as tables • Consider four binaryvariablesX1, X2, X3, X4 P( X4|X1, X2,X3 ) as a table X4 X2 X1 X3 X4 Pa(X4): X1, X2, X3
Estimating CPD table from data • Assume we observe the following assignments for X1, X2, X3, X4 X1 X2 X3 X4 For each joint assignment to X1, X2, X3, estimate the probabilities for each value of X4 N=7 For example, consider X1=T, X2=F, X3=T P(X4=T|X1=T, X2=F, X3=T)=2/4 P(X4=F|X1=T, X2=F, X3=T)=2/4
P( X4|X1, X2,X3 ) as a tree X1 f t P(X4=t) = 0.9 X2 f t P(X4=t) = 0.5 X3 f t P(X4=t) = 0.8 P(X4=t) = 0.5 A tree representation of a CPD X2 X1 X3 X4 Allows more compact representation of CPDs, by ignoring some unlikely relationships.
The learning problems in Bayesian networks • Parameter learning on known graph structure • Given data D and G, learn Θ • Structure learning • Given data D, learn G and Θ
Structure learning using score-based search ... A function of how well B describes the data D
Scores for Bayesian networks • Maximum likelihood • Regularized maximum likelihood • Bayesian score
Decomposability of scores • The score of a Bayesian network Bdecomposes over individual variables • Enables efficient computation of the score change to local changes Joint assignment to Pa(Xi) in the dth sample
Search space of graphs is huge • For N variables there are possible graphs • Set of possible networks grows super exponentially Need approximate methods to search the space of networks
Greedy Hill climbing to search Bayesian network space • Input: D={x1,..,xN}, An initial graph, B0={G0,Θ0} • Output: Bbest • Loop until convergence: • {Bi1, .., Bim} = Neighbors(Bi) by making local changes to Bi • Bi+1: arg maxj(Score(Bij)) • Termination: • Bbest= Bi
D D D C C C B B B A A A Local changes to Bi Current network Bi add an edge delete an edge Check for cycles
Challenges with applying Bayesian network to genome-scale data • Number of variables, p is in thousands • Number of samples, N isin hundreds
Extensions to Bayesian networks to handle genome-scale networks • Sparse candidate algorithm • Friedman, Nachman, Pe’er. 1999 • Bootstrap to identify high scoring graph features • Friedman, Linial, Nachman, Pe’er. 2000 • Module networks (subsequent lecture) • Segal, Pe’er, Regev, Koller, Friedman. 2005 • Add graph priors (subsequent lecture, hopefully)
The Sparse candidate Structure learning in Bayesian networks • Key idea: Identify k “promising” candidate parents for eachXi • k<<p, p: number of random variables • Candidates define a “skeleton graph” H • Restrict graph structure to select parents from H • Early choices in Hmight exclude other good parents • Resolve using an iterative algorithm
Sparse candidate algorithm • Input: • A data set D • An initial Bayes net B0 • A parameter k: max number of parents per variable • Output: • Final B • Loop until convergence • Restrict • Based on D and Bn-1 select candidate parents Cin-1for Xi • This defines a skeleton directed network Hn • Maximize • Find network Bn that maximizes the score Score(Bn;D) among networks satisfying • Termination: Return Bn
Selecting candidate parents in the Restrict Step • A good parent for Xiis one with strong statistical dependence with Xi • Mutual information provides a good measure of statistical dependence I(Xi; Xj) • Mutual information should be used only as a first approximation • Candidate parents need to be iteratively refined to avoid missing important dependences • A good parent for Xi has the highest score improvement when added to Pa(Xi)
Mutual Information • Measure of statistical dependence between two random variables, Xi and Xj
C B D A Mutual information can miss some parents • Consider the following true network • If I(A;C)>I(A;D)>I(A;B) and we are selecting k<=2parents, B will never be selected as a parent • How do we get B as a candidate parent? • If we used mutual information alone to select candidates, we might be stuckwith C and D True network
Computational savings in Sparse Candidate • Ordinary hill climbing • O(2n) possible parent sets • O(n2) initial score change calculations • O(n) for subsequent iterations • Complexity of learning constrained on a skeleton directed graph • O(2k) possible parent sets • O(nk)initial score change calculations • O(k) for subsequent iterations
Sparse candidate learns good networks faster than hill-climbing Greedy hill climbing takes much longer to reach a high scoring bayesian network Score (higher is better) Dataset 1 Dataset 2 100 variables 200 variables
Some comments about choosing candidates • How to select k in the sparse candidate algorithm? • Should k be the same for all Xi? • If the data are Gaussian could be do something better? • Regularized regression approaches can be used to estimate the structure of an undirected graph • L1-Dag learn provides an alternate • Schmidt, Niculescu-Mizil, Murphy 2007 • Estimate an undirected dependency networkGundir • Learn a Bayesian network constrained on Gundir
Dependency network • A type of probabilistic graphical model • As in Bayesian networks has • A graph component • A probability component • Unlike Bayesian network • Can have cyclic dependencies Dependency Networks for Inference, Collaborative Filtering and Data visualization Heckerman, Chickering, Meek, Rounthwaite, Kadie 2000
Selecting candidate regulators for the ith gene using regularized linear regression Candidates 1 p-1 … 1 ? ? ? 1 1 X1 …… Xp-1 Xi = bi N N Xi p-1 Regularization term Everything other than Xi L1 norm, sparsity imposing Sets many regression coefficients to 0 Also called Lasso regression
Learning dependency networks • Learning: estimate a set of conditional probability distributions, one per variable. • P(X,|X-j) could be estimated by solving • A set of linear regression problem • Meinhausen & Buhlmann, 2006 • TIGRESS (Haury et al, 2010) • A set of non-linear regression problems • Non-linearity captured by Regression Tree (Heckerman et al, 2000) • Non-linearity captured by Random forest • GENIE3, (Huynh-Thu et al, 2010)
Where do different methods rank? Random Community Marbach et al., 2012