Download
1 / 30
300 likes | 426 Vues
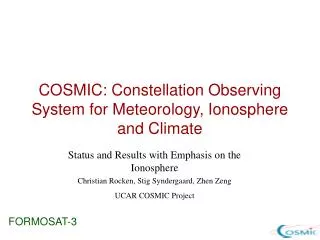
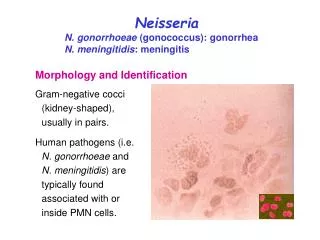
The UCAR/ Navrongo meningitis effort: Results and next steps. Key Questions, relative to this meeting. What have we learned from our research? How can this new knowledge be integrated into the outbreak response strategy?

E N D
Key Questions, relative to this meeting • What have we learned from our research? • How can this new knowledge be integrated into the outbreak response strategy? • How, generally, can the integration of research into public health actions be facilitated? • What can public health needs tell us about where to go next with research? Paraphrased from meeting agenda
Our foci Research that will improve the impact of reactive mass vaccination campaigns • Can we predict the end of an epidemic with sufficient certainty that we avoid implementing a campaign that would have little impact?1 • What criteria (epidemiological, population, climate, environment, vaccine, etc.) should be factored into a decision tree to decrease the time between epidemic onset and vaccination campaign while maintaining the same level of specificity?1 1. These questions come from the WHO Issue Paper, July 2011
Objectives and Strategies 1. Predict epidemic end by • Verifying Greenwood hypothesis linking season end and humidity • Leveraging existing meteorological forecasts 2. Characterize risk factors by • Surveying 222 households for knowledge, attitudes and practices • Testing disease models against atmospheric, demographic, and epidemiological data 3. Characterize economic impact by • Surveying 74 households for Cost of Illness 4. Inform reactive vaccination campaigns by • Developing a useful Decision Support System that includes archived and real-time data and analysis tools
The Greenwood Hypothesis… Greenwood, 1999
First Line of Evidence – Weather Simulations vs. Meningitis Cases • Mera examined link between hindcasted weather variables and cases in regions with Meningitis outbreaks • In April 2009, the Kano epidemic ended after relative humidity crossed above a 40% threshold • Attack rates fell in D’jamenaand Gaya when average relative humidity for the week rose above 40%. Slide from Roberto Mera
Second line of evidence – Local Data • Dukic analyzed monthly meningitis cases and environmental variables from 1998 to 2008 for Navrongo, Ghana • Data collected by A. Adams-Forgor, Navrongo Health Research Centre • Found that RH showed strongest correlation with number of cases • Couldn’t investigate lags because data were monthly • Yoksas found an inflection point in RH vs. cases curves at RH of 40%
Pairwise correlations between meteorological and health variables January 1998 - December 2008 for months that reported at least one case of meningitis.
Generalized Additive Models • GAM for meningitis developed by Dukic • Adjusts for time-varying confounding processes (e.g. seasonal migration) that co-vary with the weather variables • Analyzed 11 years of Navrongodata from Adams-Forgor • Reaffirms importance of temperature and RH, and shows that amount of CO in the air due to burning biomass (fires) is also related to meningitis.
Third line of evidence –Disease model tested against regional data • Start with a differential equation disease model based on known transmission dynamics • Cross-validate the model with only case data menengitis (i.e. every district/week is a unique event) • Ask if you can improve the model by including other data (over 90 variables were tried) Data came from Clément Lingani, and covered the entire belt for the 2008 and 2009 meningitis season.
Relative humidity improves prediction across the belt • Hopson and Dukic found that knowing the RH two weeks ago improves accuracy in predicting an epidemic by ~25%1 • Coupled with a two week forecast, this indicates an improved ability to anticipate a roll-off in epidemic 4 weeks in advance Using RH Without RH 1It turns out other variables (air temp, winds, NE winds) also help, but less than relative humidity
Leveraging Forecasts • Use routine forecasts from international centers. • Correct them to observations using “quantile regression” • Gives estimates of humidity and its uncertainty
Knowledge, Attitudes, and Practices Survey A 3-part survey of 74 Households who have had meningitis and 158 age/gender/region matched controls • Part I:KAP • Knowledge of meningitis • Personal and household experience with meningitis • Customs and practices • Attitudes about diseases • Part II: Socio-demographics • Education-literacy • Occupation (travel) • Housing (ventilation, sleeping arrangements) • Cooking, water, waste, etc. • Household assets; food security • Part III: Cost of Illness (Cases only) • Costs of the case • Medicine, transport to and from hospital, provision of meals, treatment • Costs in terms of missed work (either directly or for caregiver) • Costs due to sequelae • Limitations – recall bias in earlier cases
Preliminary Survey Results • In northern Ghana, a case of meningitis costs, on average, more than a year’s wages • Seasonal migration can both protect you from or increase your risk depending on when you return • Early meningitis symptoms are often misidentified, delaying treatment – suggests an intervention • At the same time, community members often over diagnose • Airborne matter (especially from local and regional burning) may increase risk
A Decision Support System • Allow regional view of forecast humidity • Zoom into a district • Observe local time-series of predicted humidity • View or download meteorological forecasts • Allow users to input case data locally • Use the trained differential-equation based model to end-of-season, and future cases • Incorporate local case data to improve local prediction • Use all contributed case data to retrain model
Funder Collaborating Institutions Department of Earth and Atmospheric Sciences, North Carolina State University, USA IRI, Columbia University, USA Navrongo Health Research Centre, Ghana University Corporation for Atmospheric Research, USA Regional Maritime University, Ghana Abudulai Adams-Forgor, Patricia Akweongo, Timothy Akwine, Dominic Anaseba, AnaïsColumbini, Maxwell Dalaba, VanjaDukic, Arnaud Dumont, Mary Hayden, Abraham Hodgson, Thomas Hopson, Benjamin Lamptey, Jeff Lazo, Roberto Mera, Gertrude NyaabaNsormah, Raj Pandya, Jennie Rice, Fred Semazzi, Madeleine Thomson, SylwiaTrazka, Tom Warner, Christine Wiedinmyer, Tom Yoksas Collaborating Individuals 26
View of West Africa looking from the northeast, with precipitable water in blue and meningitis reports by district -- no report (gray), alert (yellow), and epidemic (red).
End-of-season date (risk less than “climatological” risk) >0 cases per 105 >5 cases per 105 >10 cases per 105 >15 cases per 105 Day of Year