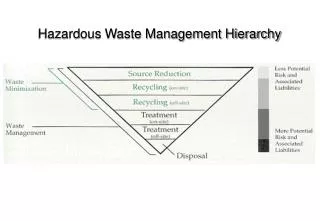
Facilities management & Disposal
Pacific Area Focus Group. Facilities management & Disposal. 1. Facilities Optimization. USPS Facilities. New Jersey Network Distribution Center – 1.4M Sq Ft. Owned 8,596. Leased 23,763. 2. Ochopee FL Post Office – 62 Sq Ft. Facilities Optimization. Objective.

Facilities management & Disposal
E N D
Presentation Transcript
Pacific Area Focus Group Facilities management & Disposal 1
Facilities Optimization USPS Facilities New Jersey Network Distribution Center – 1.4M Sq Ft Owned 8,596 Leased 23,763 2 Ochopee FL Post Office – 62 Sq Ft
Facilities Optimization Objective • Generate Revenue and Reduce Expenses by: • Selling owned buildings • Terminating leases • Re-purposing space
Advantages of a Transformed Infrastructure • Fewer Facilities • Denser Bundles/Trays and Pallets • Increased Equipment Utilization • Increased Productivities • Maximized Transportation • Better Utilization of Air/Surface Trips • Gain Economies of Scale • Right-sized Workforce • Employee Flexibility • Revised Pay Structure Complement
Pacific Area Focus Group Service Performance
Weather Impact 2013-2014 Winter Storms 22 Named Storms to Date ! ATLAS BOREAS CLEON DION ELECTRA FALCO GEMINI Hercules ION JANUS KRONOS LEON MAXIMUS NIKA Orion Pax QUINTAS REX SENECA TITAN ULYSSES Vulcan
Pacific Area Focus Group YTD SERVICE PERFORMANCE FIRST-CLASS MAIL
First-Class Service Performance Overnight 2 Day 3-5 Day - 98 96.80 96.50 - 96 95.25 - 94 - 92 % On-Time - 96.22 90 95.79 95.75 94.76 93.77 - 88 89.76 - 86 - 84 YTD FY13 YTD FY14 Target 8 * Targets Shown are FY 2014
FY 2014 YTD BEST IN CLASS FIRST-CLASS Service Performance San Fran Pacific Area Overnight 2 day Sacramento Bay-Valley 96.44 96.71 Sierra Coastal San Diego LA Santa Ana Honolulu
Pacific Area Focus Group YTD SERVICE PERFORMANCE STANDARD AND PERIODICALS
Standard Letters Service Performance SCF Letters NDC Letters - 92 91.00 - 88 - 84 - 80 % On-Time 90.42 89.60 - 89.02 88.33 76 - 72 - 68 - 64 YTD FY13 YTD FY14 Target 11 * Targets Shown are FY 2014
FY 2014 YTD BEST IN CLASS Standard Mail Service Performance San Fran Pacific Area SCF Letters Sacramento Bay-Valley 94.35 Sierra Coastal San Diego LA Santa Ana Honolulu
Standard Flats Service Performance SCF Flats NDC Flats - 91.00 90 - 86 - 82 - 78 % On-Time - 74 84.59 83.86 - 70 77.01 75.78 - 66 - 62 YTD FY13 YTD FY14 Target 13 * Targets Shown are FY 2014
Periodicals 1-2 Day Service Performance Periodicals - 92 91.00 - 88 - 84 - 80 % On-Time - 76 84.35 82.88 - 72 - 68 - 64 YTD FY13 YTD FY14 Target 14 * Targets Shown are FY 2014
The Goal Driving Efficiency Through Measurement & Diagnostics Service Performance Diagnostics From Reactive to Proactive Service Measurement Meeting Service Expectation Predictability Visibility Cost Effective and Consistently Reliable Service 15
Pacific Area Focus Group Visibility 16
100% Visibility 100% Product Visibility Provides the ability to track mail pieces and containers through the postal network and provide business intelligence to enhance operational performance and provide customer value 17
Evolution of Technology Power of Business Intelligence Power of Business Intelligence 18
Business Intelligence Apply an intelligent and trackable barcode to every mail product STRATEGY • IMb for letters and flats • IMpb for packages • IMtb for trays and sacks • IMcb for pallets and containers 19
Business Intelligence Scan all mail products for all events across the USPS network STRATEGY • Expand the number of events provided • Ensure all postal sites have scanning capability for all events • Move to real-time delivery information 20
Achieve 100% Package Visibility Technology Investments Delivery Sortation System PASS Real-Time Scanners Mobile Delivery Device (Replaces Real-Time Scanners) C007 Dec 2012- March 2014 Nov 2012-Sept 2013 Feb-May 2013 Jul 2014-Dec 2014 Jan–Dec 2014 Deployment May-Nov 2014 Deployment Jan 2015 – Aug 2015 Scanning Units Scanning Units Scanning Units Scanning Units Scanning Units Scanning Units Scanning Units Total – 12,500 Total – 4,167 Total – 225,000 210,608 75,000 150,000 11,700 3,137 1,030 800 21
USPS Total Scan Rate 97 95.85 96 95 94 Total Scan Rate 93 92 91 90 Jan Feb Mar Apr May Jun Jul Aug Sep Oct Nov Dec Jan Feb Mar Apr May Jun Jul Aug Sep Oct Nov Dec Jan Feb Mar 2012 2013 2014 FY 2014 Target Trend Line Total Actual Scan Rate
Visibility Recap • Significant Investments in Technology • Providing Real-time Visibility • Leveraging Information to Create Business Intelligence Cost Effective and Consistently Reliable Service 23