Download
1 / 18
190 likes | 219 Vues
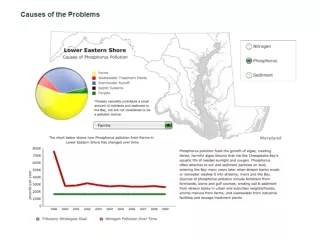
The MD Baystat website displays significant reductions in phosphorus levels across Eastern Shore tributaries from 1985 to 2000, particularly in the lower region. However, details on the actions leading to these reductions are lacking. The absence of long-term monitoring sites hampers data collection, with concerns about sediment loads in the Choptank. This text delves into projections and effects of N-based NMP and Soil and Water Conservation Plans on phosphorus reductions, alongside recommendations for modeling improvements. The research emphasizes the importance of understanding soil phosphorus concentrations, application management, and the necessity for high-quality data sets for effective decision-making and nutrient loss management in agriculture.

E N D
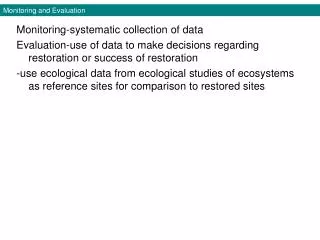
The MD Baystat website shows large P reductions in all three Eastern Shore tribs for 1985-2000, especially the lower Eastern Shore. The narrative for what actions generated these reductions is largely absent.
What about monitoring data? Unfortunately the only long-term site on the Eastern Shore is at Greensboro on the upper Choptank. RIM load data expressed on a per acre basis don’t suggest downward trends in TSS, P or N. WS 4.3 sediment loads for the Choptank seem high. LES??
Discussions Regarding How P Reductions from Agriculture on the Eastern Shore of Maryland were Projected in the CBP Watershed Model for 1985-2000MD DNRFebruary 16, 2011Follow-up June 2011 Ken Staver University of Maryland College of Agriculture and Natural Resources Wye Research and Education Center Queenstown, Maryland
The primary question remains: How were the effects of implementation of N-based NMP and Soil and Water Conservation Plans handled in the WSM to generate such large reductions in delivered P loads from ag on the LES from 1985-2000?
Scientific and Technical Advisory CommitteeSeptember 14, 2011 Nutrient Transport in Maryland Coastal Plain Watersheds:What We Know and What Next Ken Staver University of Maryland College of Agriculture and Natural Resources Wye Research and Education Center Queenstown, Maryland
Objective 1 To gain an in-depth understanding of how the CBP watershed model currently simulates phosphorus loads from cropland and whether the current simulation approach is consistent with the latest scientific consensus regarding phosphorus transport mechanisms.
Objective 2 To make recommendations regarding how the CBP modeling approach should b restructured to more accurately reflect the latest research findings regarding phosphorus transport processes and what data inputs will be needed to support calibration and verification of a restructured modeling approach.
Richard Feynman - 1986 “For a successful technology, reality must take precedence over pubic relations, for nature cannot be fooled.” “Therefore, things must be learned only to be unlearned again or, more likely, to be corrected… The test of all knowledge is experiment.”
Concluding Remarks “The overall long-term goal of efforts to reduce P losses from agriculture to surface waters should aim to balance off-farm inputs of P in feed and fertilizer with P outputs as produce, along with managing soils in ways that retain nutrients and applied P resources.”
Research Bottom Line 1. Soil P concentrations and how we manage P applications are the major drivers for P losses that we can control. 2. Changes in loads only come from changes in drivers. Need high quality pre- and post data sets. Baseline? 3. Small scale monitoring of runoff P losses impractical.