Microbes, e- flow
Dive deep into the world of microbes in Lake Champlain as we unravel the intricate processes of catabolism and anabolism, nutrient cycling, redox fronts, and microbial habitats. Discover how redox dynamics influence nutrient mobility and microbial communities in sediments, with insights from cutting-edge methods like voltammetric microelectrodes and PCA analysis. Follow along as we explore the seasonal variations in phosphorus mobility and the impact of redox changes on nutrient balance in this aquatic ecosystem.

Microbes, e- flow
E N D
Presentation Transcript
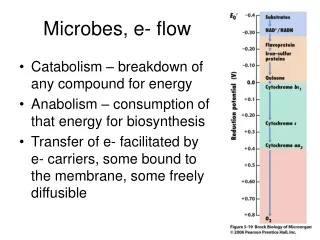
Microbes, e- flow • Catabolism – breakdown of any compound for energy • Anabolism – consumption of that energy for biosynthesis • Transfer of e- facilitated by e- carriers, some bound to the membrane, some freely diffusible
O2 Aerobes Oxic H2O Dinitrofiers NO3- N2 Maganese reducers Post - oxic MnO2 Mn2+ Iron reducers Fe(OH)3 Fe2+ SO42- Sulfate reducers Sulfidic H2S CO2 Methanogens CH4 Methanic H2O H2 The Redox ladder The redox-couples are shown on each stair-step, where the most energy is gained at the top step and the least at the bottom step. (Gibb’s free energy becomes more positive going down the steps)
Profiles and microbial habitats O2 O2 Minerals Expected? 3 2 Fe2+ depth H2S 4 H2S 1 Org. C Org. C Concentration
Diffusion, Fickian Diffusion from high to low levels.. Where D is the diffusion coefficient, dc/dx is the gradient, and J is the flux of material
Other nutrients needed for life • Besides chemicals for metabolic energy, microbes need other things for growth. • Carbon • Oxygen • Sulfur • Phosphorus • Nitrogen • Iron • Trace metals (including Mo, Cu, Ni, Cd, etc.) • What limits growth??
Nutrients • Lakes are particularly sensitive to the amount of nutrients in it: • Oligotrophic – low nutrients, low photosynthetic activity, low organics clear, clean… • Eutrophic – high nutrients, high photosynthetic activity, high organics mucky, plankton / cyanobacterial population high • Plankton growth: • 106 CO2 + 16 NO3- + HPO42- + 122 H2O + 18 H+ + trace elements + light C106H263O110N16P1 + 138 O2 (organic material composing plankton) • This C:N:P ratio (106:16:1) is the Redfield Ratio • What nutrients are we concerned with in Lake Champlain?
Nutrient excess can result in ‘blooms’
Lake Champlain • Phosphorus limited? • Algal blooms • What controls P??
Nutrient cycling linked to SRB-IRB-MRB activity PO43- PO43- PO43- PO43- PO43- PO43- PO43- PO43- Org C + SO42- FeOOH FeS2 H2S Blue Green Algae blooms Sulfate Reducers
Oxic Anoxic Redox ‘Fronts’ • Boundary between oxygen-rich (oxic) and more reduced (anoxic) waters • Oxygen input through entrainment (wind, wave action, photosynthesis) • Oxygen consumption from heterotrophic consumption, reaction with reduced forms of Fe, Mn, S
Methods • Voltammetric microelectrodes In-situ pore water measurements to determine redox front by real time analysis of O2, Fe2+/Fe3+, Mn2+, H2S • DGT (Diffusive Gradients in Thin films) to monitor P fluxes through sediment • Gravity Coring and chemical extractions of iron, manganese, and phosphorus in the sediment • Inductively-coupled plasma optical emission spectroscopy (ICP-OES) to measure iron, manganese, and phosphorus from extractant
Voltammetric data - St. Albans Bay Sediments Mn2+ + 2e- --> Mn0(Hg) H2O2 + 2e- + 2H+ 2H2O O2 + 2e- + 2H+ H2O2 Fe3+ + 1e- Fe2+ FeS(aq)
Results: • Sediments generally become more reduced as summer progresses • Redox fronts move up and down in response to temperature, wind, biological activity changes • This movement of the redox front invokes changes in mineralogy and nutrient dynamics on short time scales
Seasonal Phosphorus mobility • Redox front movement mobilizes P in the sediment over time • Movement is EVENT based – fluxes should vary significantly in time. We currently have little idea what P fluxes are out of the sediment • Profiles show overall enrichment of P, Mn, and Fe in upper sections of SAB sediment • Fe and Mn would be primarily in the form of Fe and Mn oxyhydroxide minerals transformation of these minerals is key to P movement
P Loading and sediment deposition • Constantly moving redox fronts affect Fe and Mn minerals, mobilize P and turn ideal profile into what we actually see…
Redox changes and Nutrients • We have linked at least some component of P dynamics to redox changes and Fe, Mn mineralogy – this is one of several processes that would affect nutrient balance in these bay systems however. • Nitrogen speciation and availability may also be affected by these processes, but potentially in very different ways – hence there may be some background control on N/P ratio which may affect algal community dynamics
PCA analysis of Restriction Fragment Length Polymorphism analysis from DNA extracted from 4 geochemically distinct zones and a 1mm buffer zone between 1 – Oxic, top mm of sediment 2 – Buffer – 1 mm 3 – Nitrate reduction 4 – buffer 2 – 1 mm 5 – manganese reduction 6 – buffer – 1 mm 7 – iron reduction 8 - bottom of sediment column Geochemical niches and microbial community changes in Saint Albans Bay, Lake Champlain, sediments
Can reducing conditions force P out of the sediment and into the overlying water column? Incubation experiments: Oxic Anoxic From the volumetric analyses and visually (red is FeOOH oxidized iron, black is FeS reduced iron and sulfur) we see the difference in the redox condition between the two cores.
DGT films in incubation experiments • Diffusive Gradients in Thin films (DGT) probes put into sediment (½ in sediments, ½ in water above) to measure time-averaged P release in 2 incubation experiments DGT films definitively show potential for significant release of P into pore water and overlying water column on reduction of the Fe minerals present