Chart Pattern Detection on Multiple Timeframe
X3 Chart Pattern Scanner comes with the ability of detecting pattern across different timeframe. This feature is handy because you can scan potential buy and sell signal from one chart only. Here we show how to do it in your chart. Simply go to input setting. Then set u201cUse Multiple Timeframe Pattern Detectionu201d = true. Check the screenshot for the procedure.<br><br>Of course, the pattern detection at multiple timeframe will force 6 to 9 times heavier computation to your MetaTrader. Hence, this will push your CPU and Memory higher. Before using this multiple timeframe feature, please do understand the
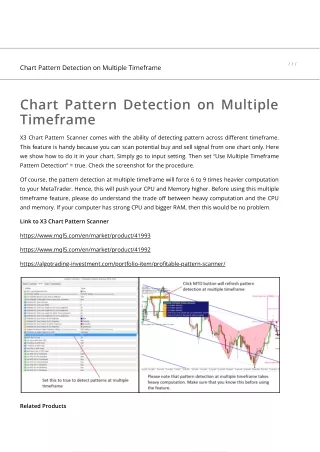

Chart Pattern Detection on Multiple Timeframe
E N D
Presentation Transcript
/ / / Chart Pattern Detection on Multiple Timeframe Chart Pattern Detection on Multiple Timeframe X3 Chart Pattern Scanner comes with the ability of detecting pattern across di?erent timeframe. This feature is handy because you can scan potential buy and sell signal from one chart only. Here we show how to do it in your chart. Simply go to input setting. Then set “Use Multiple Timeframe Pattern Detection” = true. Check the screenshot for the procedure. Of course, the pattern detection at multiple timeframe will force 6 to 9 times heavier computation to your MetaTrader. Hence, this will push your CPU and Memory higher. Before using this multiple timeframe feature, please do understand the trade o? between heavy computation and the CPU and memory. If your computer has strong CPU and bigger RAM, then this would be no problem. Link to X3 Chart Pattern Scanner https://www.mql5.com/en/market/product/41993 https://www.mql5.com/en/market/product/41992 https://algotrading-investment.com/portfolio-item/pro?table-pattern-scanner/ Related Products
EFW Pattern Trader Volume Spread Pattern Indicator Harmonic Pattern Plus Turning Point Detector Share this entry Related Posts: Multiple Timeframe Pattern Multiple Timeframe Pattern Scanning for Harmonic Scanning for Harmonic MetaTrader Indicators and MetaTrader Indicators and Introduction to Advanced Introduction to Advanced Pattern… Pattern… Pattern Scanners Pattern Scanners Price Pattern Scanner (Non… Price Pattern Scanner (Non… Mean Reversion Supply Mean Reversion Supply Scan Supply Demand Zone Scan Supply Demand Zone Guide to Harmonic Pattern Guide to Harmonic Pattern Demand Multiple TimeFrame Demand Multiple TimeFrame Across All Timeframe Across All Timeframe Plus Plus analysis analysis Mean Reversion Supply Mean Reversion Supply Demand-“Shown/Hidden + Demand-“Shown/Hidden + Introduction to Harmonic Introduction to Harmonic Timeframe… Timeframe… Pattern Scenario Planner Pattern Scenario Planner
Website Menu ● Customer/Member Login ● Technical Indicator & Expert Advisor ● Optimum Chart ● Forex Market Prediction ● Harmonic Pattern Signal ● Free Download ● Free Trading Education ● Contact us ● About us Search Contents By Keyword Enter Here Recent Reviews Fractal Pattern Scanner MT5 1 Year by Martin Dobry Fractal Pattern Scanner MT5 1 Year by a15502286655 Optimum Chart Forex 1 Year by Naomi T Time Box Indicator MT4 by Harald Wenzl Pair Trading Station - MT4 1 Month by Rafael C. Name* Admin ATI
Email* customer.support@algotrading-investment.com Subscribe and Get Discount Coupon © Copyright - All contents reserved by Algo Trading & Investment.