Download
1 / 17
170 likes | 188 Vues
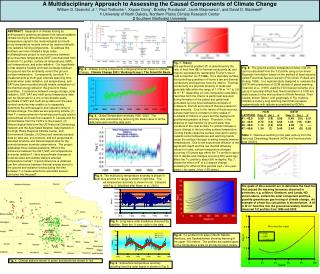
This presentation focuses on the scientific approach to climate change impacts studies, including the supply of indices and downscaling of variables, as well as the evaluation of data and inclusion of translational information.

E N D
NCPP – needs, process components, structure of scientific climate impacts study approach, etc.
NCPP - Two main elements identified so far NCPP Providing future downscaled and value-added climate information Archiving and providing a repository of best practices standards/guidance, tools, etc. Digital data access Translational information Documentation
Types of needs*, identified so far • # 1 - Supplying already existing downscaled data that fulfill the open-source and review (quality) criteria in GIS format • For non-standard areas – watersheds, states, other • # 2 – Re-gridding or interpolation to locations of already existing downscaled data – tools and translational information • # 3 - Supplying sets of indices (value-added information) by sector as needed for climate change impacts studies • For different spatial scales – states, regions, cities, watersheds, ecological regions, other • # 4 - Downscaling variables not available in existing downscaled data set portals • Standard available variables from existing portals – tmax, tmin, precipitation, on monthly or daily scale • Supplying this data in GIS format • Re-gridding as necessary • Supplying application-specific indices • # 5 – Supplying narratives relative to specific variables, and sectors and at specific spatial scales – historical and for future periods (what has happened, what is going to happen) • # 6 – Supplying translational information relative to downscaling methodology, uncertainty of results, interpretation of results, re-gridding procedures, etc. * the needs are not listed based on importance or priority
This presentation focuses first on: • Details related to need # 3 - Supplying sets of indices (value-added information) by industry as needed for climate change impacts studies • Details related to need # 4 - Downscaling variables not available in existing downscaled data set portals
Scientific approach to climate change impacts study • Some definitions • Index or measure - a number derived from observations or simulations • Growing Degree Days, Heating and Cooling Degree Days, frequency and intensity of heat waves, Cold spells, date of first fall frost and last spring frost, exceedance probability of annual precipitation, persistence of rain/dry days, etc. • Ensemble - A group of parallel model simulations used for climate projections. • Variation of the results across the ensemble members gives an estimate of uncertainty. • Ensembles made with the same model but different initial conditions only characterize the uncertainty associated with internal climate variability • Multi-model ensembles including simulations by several models also include the impact of model differences.
Comparison of the model simulations and the observational data sets for the historical period 1951-1999 Evaluation of the precipitation variability during 2001-2099 Starting stage – need # 3Structure of a climate impacts study - focus on process when using readily available downscaled data Example: Historical and projected future precipitation variability in the Colorado River Basin Assessment of the quality of the observed gridded data sets for the 1951-1999 period
Assessment of the homogeneity of the observed gridded data sets for the 1951-1999 period Comparison of the model simulations and the observational data sets for the historical period 1951-1999 Evaluation of the precipitation variability during 2001-2099; Inclusion of translational information – how to interpret the results and the uncertainty Structure of a climate impacts study - focus on process when using readily available downscaled dataExample: Historical and projected future precipitation variability in the Colorado River Basin Quality assessment of observed data; Inclusion of translational information Bias evaluation of the GCM downscaled data; Inclusion of translational information – how to interpret the biases Results may impact: Set of models used in future precipitation changes analysis (choice of best models) Interpretation of results (choice of interpretation based only on non-biased models)
Early future period 2001-2049 Mid future period 2026-2074 Downscaled by L. Brekke et al. Downscaled by J. Eischeid (NOAA) Late future period 2051-2099 Downscaled by L. Brekke et al. Downscaled by L. Brekke et al. Downscaled by J. Eischeid (NOAA) Downscaled by J. Eischeid (NOAA) A2 B1 A1b A1b B1 B1 A2 A2 A1b A1b A1b A1b Evaluation of the precipitation variability during 2001-2099 Description of measures’ calculation Calculated set of measures of precipitation variability Calculate deltas (changes) for all GCM future periods versus the GCM historical period Qualitative or quantitative comparison of the future changes between periods, SRES emissions scenarios, and downscaling methodologies Description of deltas calculations, comparison methodology, interpretation of results and uncertainty
Summary - Using already downscaled data sets – for ex., Maurer et al., Hayhoe, NARCCAP, other Access to downscaled GCM and/or RCM data and to observed data: Data set 1 – multiple GCMs, SRES emissions scenarios Data set N – multiple GCMs, SRES emissions scenarios Observed data set 1, 2 Quality control, homogeneity, testing, if needed Feedback from users Calculation of measures/indices Translational info about GCM biases Validation - comparison between GCM and observed measures/indices during historical period of overlap Products: a) future changes in various measures/indices of interest for time segments or overlapping periods, with uncertainty assessment, b) narratives, c) probabilistic distributions of measures/indices, d) other Translational information: Interpretation guidance of results, Uncertainty around the measures/indices,Details of Probability distributions’ methodology
Observed data sets Gridded data: Maurer et al. 2002 – daily and monthly; ~12 km resolution PRISM – Precipitation Regressions on Independent Slopes Model, (Daly et al 2004, 2006) –monthly, 4 km or less resolution Station data Located at NCDC or at state climatologist offices: Data from COOP stations - daily, monthly Data from the Historical Climatology Network (homogenized) – monthly Downscaled data sets: Gridded data: Maurer et al. 2007 CMIP3 BCSD downscaled monthly data set, approx. 12km, 1950-2099, 16 GCMs, 36 projections, 3 SRES scenarios Hayhoe downscaled daily data set – to be serviced by USGS – approx. 12km, tmax, tmin, precip, 1960-2099, 4GCMs, 4 SRES scenarios, CONUS and Alaska NARCCAP dynamically downscaled data set CMIP3 BCCA downscaled daily data set – same spatial domain as BCSD; same resolution; 3 time periods 1961-2000, 2045-2064, and 2080-2099; tmax, tmin, precip Project portals at institutions Station or location data At Universities, institutions Examples of existing data sets for the US that can be used:
Generalization - Using already downscaled data sets – for ex., Maurer et al., Hayhoe, NARCCAP, otherComponents of the process Access to downscaled GCM and/or RCM data Access to observed data: Quality control tool Feedback from users Calculation of measures/indices Translational Information tool Validation of measures/indices tool Ensemble analysis tool; Uncertainty analysis tool; Probabilistic distributions tool, other Products Translational information tool
Access to downscaled GCM and/or RCM data and to observed data: Downscaling GCM and/or RCM data; Access to observed data: Data set 1 – multiple GCMs, SRES emissions scenarios Data set 1 – multiple GCMs, SRES emissions scenarios Data set N – multiple GCMs, SRES emissions scenarios Data set N – multiple GCMs, SRES emissions scenarios Observed data set 1, 2 Observed data set 1, 2 Later stagesStructure of a climate impacts study - focus on process when downscaling GCM and/or RCM data The main differences are related to the beginning of the process and the access to data portals of raw GCM and/or RCM data and the subsequent downscaling of the GCM or RCM data. The subsequent slides focus on the downscaling procedures when using different downscaling techniques. START LATER
Structure of a climate impacts study – focus on downscaling process (statistical or empirical –dynamical downscaling) User identified requirements for the downscaled product – Measures/indices of interest, temporal and spatial scales User and provider agreed upon sources of uncertainty Set of GCMs, SRES emissions scenarios, downscaling techniques Access to observed data sets of the variables of interest and predictors (if needed) - quality controlled, homogeneous Access to rawGCM data sets of the variables of interest and of the predictors (if needed) Apply transfer functions on GCM predictor data for control period Develop transfer functions for a given period Validate transfer functions on separate period Comparison indicates downscaling biases Validate CGM transfer functions for control period vs OBS data Comparison indicates GCM + downscaling biases Apply transfer functions on GCM future data to obtain downscaled projections Products - Calculate additional indices of interest, potential changes, or downscaled data needed for input in process models, other
Structure of a climate impacts study – focus on downscaling process (dynamical downscaling) User identified requirements for the downscaled product – Measures of interest, temporal and spatial scales User and provider agreed upon sources of uncertainty Set of GCMs, SRES emissions scenarios, downscaling techniques Definition of “observed”, “current”, “control” and “future” climates for RCM simulations and the types of comparisons that must be performed. Note that it is not appropriate to compare future climate projections directly to observations. (Winkler et al., 2011) Products: time series, climatologies, potential changes for future time slices, other
Structure of a climate impacts study – focus on downscaling process - Example – Maurer et al. 2007 downscaling effort (disaggregation downscaling) Step 1 Bias correction Observed gridded data GCM 20th century data GCM 20th century data Re-grid observed and GCM 20th and 21st century data to same resolution (2º) For each grid cell, create monthly cumulative distribution functions (CDFs) by variable of interest Create quantile map By grid cell and for each month, adjust the 20th and 21st century GCM data by using the OBS values for given quantiles of the CDF Step 2 Spatial Down- scaling Interpolate 2º factor values to 1/8º Compute Factor values by grid cell and time step Apply factor values to original 1/8º observed data - Resulting in BSCD GCM data
Comparison of the model simulations and the observational data sets for the historical period 1951-1999 Observed data sets GCM data sets Downscaled by L. Brekke et al. (2007) Maurer et al. 2002 Gridded observed data 37 model runs Downscaled by Jon Eischeid (NOAA) PRISM (Daly et al. 2004, 2006) Gridded Observed data 30 model runs Calculated variables/measures compared to: Translational info about the data sets; the comparison methodology; about the interpretation of the biases of the downscaled data;