Download
1 / 29
290 likes | 443 Vues
Microbial Communities & Feeding Specialization of Insects at The Sevilleta LTER. Dan Colman. Focal Organism – Epicauta longicollis. Member of Meloidae family 18-25 mm in length, slender, elongated body form Found throughout desert southwest & Mexico Emerge in early summer

E N D
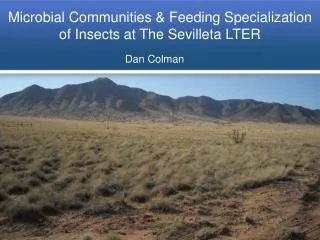
Microbial Communities & Feeding Specialization of Insects at The Sevilleta LTER Dan Colman
Focal Organism – Epicauta longicollis • Member of Meloidae family • 18-25 mm in length, slender, elongated body form • Found throughout desert southwest & Mexico • Emerge in early summer • Occur in swarms, feed on varying flowering plants • Predominantly feeds on Solanum elaeagnifolium at the Sevilleta LTER (Schafer & Toolson, 2007)
Solanum elaeagnifolium(silverleaf nightshade) • Perennial weed native to the western U.S. & S. America • 0.3 - 0.9m in height • Very low soil quality & water requirements – adapted to semi-arid environments • Contain varying levels of alkaloid neurotoxin, solanine, throughout plant • Problematic for ranchers • 3-6 mg/kg body weight can lead to fatality • Grazing is very minimal • E. longicollis only known grazer at the Sevilleta LTER
Previous Research On E. longicollis • Behavioral studies recently conducted at the Sevilleta LTER by Schafer & Toolson • Investigation into the feeding behavior of E. longicollis • Strong evidence seen for feeding preference on varying plant parts • Specialization seen in feeding indicates adaptation to feed predominantly on a plant of known high toxicity
Objectives For The Study • Characterize the microbial community residing within E. longicollis • Compare against microbial communities within other insects of same region (various feeding habits) • Analyze microbial communities over time intervals for changes in structure • Analyze intraspecific community variation • Determine if microbial community growth on S. elaeagnifolium media mirrors E. longicollis feeding preference
Hypotheses • Hypotheses: Specialized feeders like E. longicollis will have a more specialized microbial community than non-specialized feeders. Microbial growth quantities & species richness on S. elaegnifolium media will mirror E. longicollis feeding preference Analysis between individuals of the same species will show less variability than analysis interspecifically
Justification For Research • To adequately understand natural history of insects – an understanding of endemic microbial communities is necessary • Contribute to the understanding of co-evolution between microbial communities & their hosts • E. longicollis’ specialized diet may indicate the presence of a novel microbial strain/organism in microbial community • Add evidence for hypotheses about microbial dispersal among distinct “island” habitats http://www.jgi.doe.gov/education/bioenergy/bioenergy_4.html
Environmental Sampling – A genetics Based Approach • Cultivation is inherently biased to a few types of microorganisms, often not the most important • Useful as a supplement to a genetics based approach • Estimated that a very small amount of bacteria are culturable • The most effective technique available for sampling microbial communities • Allows us to take a snapshot at a specific time of community
Environmental Sampling – A Genetics Based Approach Community Sample Total Community DNA Selection & Amplification of Target Genes Insertion of Target Genes Into Vector Vectors Taken In By Live E. coli Cells Data Analysis E. coli Colonies Grown, Samples Selected at random Each Culture’s Plasmid (Vector) DNA Harvested & Sequenced
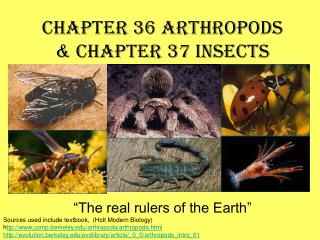
Other Species Sampled Omorgus scutellaris Pasimachus elongatus • 9-15 mm in length • Found in southern U.S. & Mexico (arid areas) • Associated with scat, particularly coyote & owl • Detritivores (fur, skin, feathers in scat) • 21-28 mm in length • Found from plains of S.W. north to Canada • Feed on smaller invertebrates
Other Species Sampled Trimerotropis pallidipennis • 25-45 mm in length • Found from British Columbia to Mexico • Generalist feeder (grasses and forbs) Eleodes longicollis • - Common darkling beetle of the desert southwest • Feed on bits of seeds & vegetation (associated with Pogonomyrmex rugosus ants) • Defensive secretions that give them the “stinkbug” pseudonym
Other Species Sampled Cibolacris parviceps (cream grasshopper) • 20 – 32 mm in length • Found throughout the S.W. U.S. into northern Mexico • Thrives in desert habitats • Feeds on creosote bush
Study Sites • All insects sampled from two areas within close proximity (~6 km) and of similar vegetative growth
Sampling Methods • Each species sampled from one of the two site locations • 3 individuals initially sampled for all 5 comparison species – 1 individual captured every week for two weeks • Epicauta sampling differed • Samples cooled upon capture • Frozen upon returning from the field
Dissection/Preparation for DNA Extraction • Dissections were performed using sterile technique • Performed as soon as possible upon return from field • Dissection protocol identical for every sample • Entire intestinal tract prepared for sampling by adding to a phosphate buffer solution
DNA Extraction • Bead beating step first used to help bring sample tissue into a useable solution • Chemical process employed using standard DNA extraction protocol • Cells in solution lysed (CTAB) • Free proteins digested (Proteinase K) • Cell membranes pulled apart (SDS Detergent) • DNA in solution separated by extracting DNA into distinct layer (Chloroform) • DNA precipitated out of solution into a pellet form Pure DNA
Polymerase Chain Reaction • Enables us to select for one gene & amplify quantity of that gene “found” in solution • Reaction targets 16s rRNA gene – conserved across microbial lineages • A reaction mixture is made with all the necessary reagents for target genes to be duplicated according to standard PCR protocol (primers, polymerase, nucleotides, sample DNA, reaction buffer) • Universal primers used
Polymerase Chain Reaction • Reaction mixtures are first heated • Allows DNA double strands to separate • Then cooled – Primers attach at target gene ends • Reaction then slightly heated again - polymerase attaches • Polymerase attaches free nucleotides to template at primer 3’ end • Gene duplicate copies are exponentially made with every full cycle (a total of 30 cycles) – potentially many 16s rRNA genes representing many different microbes can be amplified hundreds of thousands of times • PCR is a sensitive process – troubleshooting often required to have a successful reaction
Monitoring For Positive Results • PCR products analyzed before moving forward • PCR reaction products ran on agarose gels • Gels analyzed for fluorescence at 1500- 1600 base pair level which indicates presence of 16s rRNA in reaction product • Successful reactions saved for processing
Inserting Target Genes Into Vectors • Target genes must be isolated & separated from one another • Insert each target gene into a “cloning vector” • Each copy obtained from PCR now isolated from one another • “Housed” individually in vectors • Reaction with PCR product & vectors • Upon incubating the reaction at room temperature, our target gene is taken in by the vector
Vectors Taken Up By Live Escherichia coli • E. coli possess the ability to uptake free DNA from environment • Reaction promotes uptake of vectors (with target genes now inserted) • Each E. coli cell represents one of our target genes • Cells cultivated & colonies formed • Each colony will contain identical copies of vector within all cells of colony • 96 colonies will be selected at random per each insect sample http://strubiol.icr.ac.uk/extra/baculovirus/bact_protocols.html
Vector DNA Harvested From E. coli • Plasmid DNA is harvested from colony samples • Similar process to DNA extraction initially performed • Each colony’s DNA then sequenced • All 96 sample’s sequences ran through National Center For Biotechnology’s Database of known sequences • Nucleotide sequence similarity/distance indicates relatedness to known species • 96 sequences per insect sample now available for analysis http://biosci.sierracollege.edu/resources/bio-teaching/pcr-id.html
Environmental Sampling – A Genetics Based Approach Community Sample Total Community DNA Selection & Amplification of Target Genes Insertion of Target Genes Into Vector Vectors Taken In By Live E. coli Cells Data Analysis E. coli Colonies Grown, Samples Selected at random Each Culture’s Plasmid (Vector) DNA Harvested & Sequenced
Genetic Sampling Supplement: Cultivation Experiment • 6 teas were made using Solanum elaeagnifolium plant tissue • 3 types of plant tissue – 2 treatments • Concentration of tissue/water constant for all 3 • Tea medium filter sterilized • Inoculated with pool of Epicauta intestinal material • Incubated for 9 days • Samples to be genetically identified
Preliminary Observations • Preliminary microscopy • All 3 medium types look similar • Cell counts seem to be low • Predominantly a few shapes seen • Genetic sampling of all 6 treatments necessary for conclusions to be made
Future Data Analysis • Each sequence represents one data point (one microbe individual originally in sample) • Rarefaction Curves with unique sequences • Cluster Analysis: Arrange sequences into phylogenetic trees (per each sample, all samples total, per each species, etc.) • Significant differences in community structure can be analyzed between 1) Individuals of the same species 2) All species 3) Species of different feeding behavior (specialized/non-specialized) 4) Different collection time points Mesak et al. BMC Microbiology 2004 4: 6
Predictions For Results • There will be a significant difference in communities between specialized & non-specialized feeders • Intraspecific analysis will show less variability than analysis interspecifically • Community analysis of growth in medium will show less diversity along a gradient with known solanine presence
Acknowledgements Dr. Cristina Vesbach Dr. Eric Toolson Jennifer Johnson NSF & UNM Sevilleta LTER Scott Collins, John Dewitt, Don Natvig U.S. Fish & Wildlife All of the REUs who helped throughout the summer: especially Emerson Tuttle, Ash Schafer, Damon Lowery, Ashley Melendez & Emily Stinson.