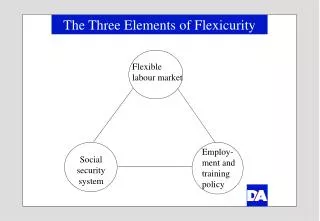
The Three Elements of Flexicurity
250 likes | 421 Vues
This document examines the concept of flexicurity, which integrates flexible labor markets with robust employment and training policies, and comprehensive social security systems. It evaluates employment security on a scale from 1 to 10, illustrating job satisfaction levels among employees and various metrics of labor market regulation. The analysis includes statistical data from various sources, such as unemployment rates and educational attainment, providing insights into how different countries manage labor market flexibility while ensuring security for workers.

The Three Elements of Flexicurity
E N D
Presentation Transcript
The Three Elements of Flexicurity Flexible labour market Employ-ment and training policy Social security system
Employment Security Scale from 1-10 – the higher the number the more secure, 2001 (3,9) (4,8) (3,9) (7,0) (8,4) (7,7) (8,2) (4,4) (5,3) (6,8) (9,4) (8,6) (7,7) (8,9) NOTE: Figures in brackets are unemployment rates in 2006. SOURCE: CEPS (2004) and Eurostat.
Job Satisfaction Per cent of employed, 2006 NOTE: The figures show the rate of employed who are satisfied or very satisfied with their occupation. SOURCE: EFILWC (2007).
Is Globalisation a Threat or an Opportunity SOURCE: The European Commission Special Eurobarometer, The Future of Europe, May 2006.
Average Job Tenure Years SOURCE: OECD (2004) and Eurostat (2005).
Labour Market Regulation Index, the lower the number the less regulation, 2003 SOURCE: OECD, 2004.
Regulation and Unemployment Unemployment, per cent 2003 ES GR FI FR DE Estimated line BE IT US PT SE DK JP UK IE AT NL Employment regulation index 2003 NOTE: A high number reflects tight regulations. SOURCE: OECD (2004)
Centrally Locally Flexibility in Wage Setting Per cent of employees where wages are negotiated: 16 34 66 84 1989 2005 NOTE: DA/LO area. SOURCE: DA.
Flexibility in Working Hours NOTE: The figures represents collective agreements for approximately 90 per cent of the employees at the DA/LO area. SOURCE: DA.
Mobility in the Wage Distribution Per cent of employees in 1st wage decile who are in a higher wage decile 1 year after. 1999-2000. SOURCE: European Commission, 2003.
Participation in Continuing Education Per cent of employed, 2003 NOTE: Covers non-formal job-related continuing education and training over the previous 12 months. SOURCE: OECD (2006).
Educational Costs at Company Level Per cent of total labour costs for educational training in private companies, 1999 SOURCE: Eurostat (2002).
Educational Attainment Per cent of labour force (25-64 year-olds) with higher education Israel Israel Canada Canada USA Japan Japan Korea Finland Belgium USA Sweden Finland Belgium Sweden Denmark Norway Ireland Australia Norway Ireland Spain Holland Australia Korea UK UK Denmark Spain France Switzerland Holland Island Island Germany Switzerland Luxembourg Luxembourg New Zealand France Germany New Zealand 50 60 50 40 30 20 10 0 10 20 30 40 60 2004 2020 SOURCE: OECD and FN.
People on public benefits 1,000 people, 2006 Job training, rehabilitation, etc. Employable Early retirement (including65-66 year old pensioners) Less employable SOURCE: Statistics Denmark.
Low Availability of Unemployed Per cent of unemployed, 2005 Years old SOURCE: Special report from Statistics Denmark.
Making Work Pay • Incentives to work for the lowest paid are small • 26 per cent of the unemployed gain less than 70 Euro/month if they get a job. • 12 per cent of the employed gain less than 70 Euro/month compared with the unemployment benefit. • 5 per cent of the employed earn less than if they were unemployed. SOURCE: Rockwool Foundation (2003).
Expenditure on Labour Market Measures Per cent of GDP, 2005 SOURCE: OECD (Employment Outlook, 2007)
GDP per capita EU-25=100 calculated in PPP, 2006 SOURCE: OECD, 2007.
Unemployment Per cent EU 15 USA Denmark Japan SOURCE: OECD (Employment Outlook, 2007).
Employment rate Per cent of 15-64 years old SOURCE: OECD (Employment Outlook 2007).
Population – Working Age 15-64 years old relative to entire population, index 2005=100 USA Denmark Western Europe Japan SOURCE: UN, World Population Prospects, Medium variant.
Flexible Regulation in Denmark Main Characteristics Basic principles established more than 100 years ago Regulation at company-level through collective agreements Disputes are handled by the two sides of industry solely
Employment Regulation Collective agreements the primary regulation: Wages Working time, overtime Redundancies, shop stewards, extra holidays Sickness pay, maternity leave, pension, training, Legislation only on specific topics: Holidays Health and safety Equal pay and equal treatment (sex, race, religion etc.)
Regulation by Framework Agreements Collective agreements cover aprox. 90 pct. of the employeed in companies affiliated to DA member federations Framework agreements Supplemented by agreements at company level
Collective Agreements and Legislation Legislation is built on and in respect of provisions in Collective Agreements The Social Partners have the prerogative when implementing EU-Directives