Program Measures and Metrics that Matter
490 likes | 532 Vues
Learn about the important measures and metrics for evaluating EH&S programs. Explore the factors that influence staffing needs and how to benchmark your institution's program. Gain insights on comparing EH&S programs in universities.

Program Measures and Metrics that Matter
E N D
Presentation Transcript
Program Measures and Metrics that Matter Robert Emery, DrPH, CHP, CIH, CSP, CBSP, CHMM, CPP, ARM Vice President for Safety, Health, Environment & Risk Management The University of Texas Health Science Center at Houston Professor of Occupational Health The University of Texas School of Public Health
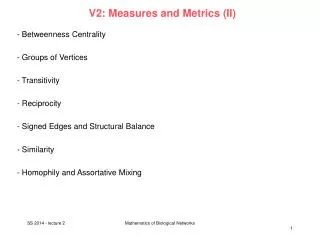
Learning Objectives By the end of this learning module, you should be able to: • Identify basic institutional descriptors. • Identify staffing predictors and influencing factors. • Understand the difference between measures and metrics. • Describe the EH&S metrics model, identifying the four major categories of measurements we suggest to use as a balance scorecard. • Describe the difference between output and outcome.
What are Our Drivers? • To begin to articulate the risk control needs of an institution, we first must understand its basic characteristics • To accomplish this, we need some basic descriptive institutional data • Such as…
How big is your institution? How is size measured? What measures are important (e.g. resonate with resource providers?) What risks are present? How are these risks managed? Are these risks real or hypothetical? How might you determine that? How does management determine that? Institutional Measures
How many staff? In your opinion, are you over or understaffed? How would you know? How would others know? How are you performing? Within the context of the mission of your institution, is your program viewed as hindering or helping? How is your program’s performance measured? In your opinion, are these measures true indicators of performance? What do the clients served really think of your program? Do clients feel there are real (or perceived) loss prevention program duplications of effort? Loss Prevention Measures
Loss Prevention Staffing • An age old question - How many EH&S staff should I have? • Perhaps an equally important question is: What can we realistically hope to obtain from a benchmarking exercise involving staffing metrics? • At best, we can likely only achieve a reasonable estimation of “industry averages”, such as number of EH&S FTE’s for an institution exhibiting certain characteristics
Quantifiable Institution size Number of labs Level of funding Population Geographic location Deferred maintenance Public/private Medical/Vet schools Multiple locations Non-quantifiable Regulatory history & scrutiny Tolerance of risk by leadership Level of trust/faith in program Ability of program to articulate needs Sampling of Possible Staffing Predictors and Influencing Factors
Desirable Characteristics of Predictors for Benchmarking • Consistently quantifiable • Uniformly defined by a recognized authority • Easily obtained • Meaningful and relevant to decision makers (provides necessary context) • Consider something as simple as the definition of “number of EH&S staff”
A Word About Comparisons: What do Universities Compare? • Revenues • Tuition and fees • Size • Number of students • Research productivity • Number of faculty • School rankings • Athletics • Student entry grade point average, SAT scores • Amount of grant funding and by whom • Revenues from Tech Transfer • Reputation • And people don’t think you can compare EH&S programs?
Suggested Definition • “EH&S Staff”: technical, managerial, and directorial staff that support the EH&S function • Suggest including administrative staff, but it probably doesn’t make a big difference • Can include staff outside the EH&S unit, but must devote half time or greater to safety function (0.5 FTE) • Example • Safety person in another department • Student workers (>0.5 FTE) • Contractors included only if onsite time is half time or greater (0.5 FTE) • Example – • contract lab survey techs, yes if >0.5 FTE • fire detection testing contractors, likely no.
Ongoing Research on Possible Predictors for EH&S Resourcing • Exploring three promising relationships – all imperfect, but each potentially useful with some degree of care • Campus square footage (non-lab and lab) • Cost of risk transfer (insurance premiums for property and worker’s compensation insurance) • Proportion of extramural research expenditures
Current C/U Metrics Model # EH&S FTE = e [(0.516*School) + (0.357*ln (Lab NASF)) + (0.398*ln (Nonlab NASF)) + (0.371*BSL)] - 8.618] R2 value based on 69 observations = 80% • Definitions for predictor variables: • Lab NASF: the number of lab net assignable square footage • Nonlab NASF: the number of non-lab net assigned square footage (usually obtained by subtracting lab from gross) • School: defined as whether your institution has a medical school as listed by the AAMC or a veterinary school as listed by the AAVMC; 0 means no, 1 means yes • BSL: this variable indicates if the institution has a BSL3 or BSL4 facility; 0 means no, 1 means yes
Staffing Predictors • The data from 102 colleges and universities from across the country indicate that four variables can account for 80% of the variability in EH&S staffing: • Non lab net assignable square footage • Lab net assignable square footage • Presence of Medical or Vet School • Existence of BSL-3 operations • These predictors important because they are recognized and understood by those outside the EH&S profession • With the collection of more data, the precision of the model could likely be improved to the benefit of the entire profession
Campus Square Footage, SHERM Resource Needs, and Funding (modeling not inclusive of resources provided for, or necessary for Employee Health Clinical Services Agreement) Modeled SHERM Resource Needs and Institutional Allocations (Not Inclusive of EHCSA) Total Campus Square Footage and Lab/Clinic Subset Amount not funded IMM funding Lab area portion of total square footage Institutional allocation Non-lab portion of total square footage SHERM Income (Worker’s compensation insurance rebates, contracts, services) Med Foundation Training Services UTP contract WCI RAP rebate * * In addition to $214,710 from “Employee Health Account”, EHCSA received 90% of FY09 WCI RAP allocation
Estimated Annual UTHSC-H Institutional Services Cost per Square Foot(FY 10 estimates based on UTHSC-H square footage of 3,164,000 state (a) + 1,836,000 auxiliary = 5,000,000 ft2 (b) ) • Utilities (electricity, gas, steam)a $5.38 • Facilities Services (salaries, maint & ops)a $2.98 • Policea $1.00 • Information Technology Supporta $1.00 • Contract Services (housekeeping, trash)a $0.58 • Insurance Premiums (property, WCI)b $0.50 • Environmental Health & Safetyb $0.45
Ratio of Reported Total EH&S Budget and Extramural Research Expenditures
FY10 Cost of SHERM Institutional Services by Square Footage Type (not inclusive of insurance premiums or employee health clinical services costs) $15 $10 Dr. Ferrari Dr. Fisher-Hoch Dr. Gould Dr. Jagganath Dr. Koehler Dr. Sevick-Muraca Dr. Soto Cost per Square Foot $6.35 + $2.73 + $0.12/sqft = $9.20 for all “intensive care” lab or clinic sqft (0.4% of total space) $5 $2.73 + $0.12/sqft = $2.85 for all standard lab or clinic sqft (15.6% of total space) $0.12/sqft for all sqft 15.6% 84% Additional amount necessary to support “intensive care” space subset in FY10 equals $150,000, or a 5% increase based on previously projected FY10 budget of $3,001,177 0.4% Percent Total Net Assignable Square Footage, based on a total for FY10 of 5,519,788 Square Feet
3. Institutional & EHS Non-transformed Data Ratios (n= 118) from CSHEMA “Vital Statistics” Initiative
Regression Model for EHS Full-time Equivalent Staff for All Institutions, n=118 ln (EHS FTE staff) = -19.6877 + 0.49324 * ln (total institutional assignable sf) + 0.72440 * ln (total institutional expenditures)
Regression Model for EHS Expenditures for All Institutions, n=118 ln (EHS expenditures) = -7.8093 + 0.50506 * ln (total institutional assignable sf) + 0.69283 * ln (total institutional expenditures)
Regression Model for EHS FTE Staff for AAHC Institutions, n=31 ln (EHS FTE staff) = -9.039 + 0.7899 * ln (total institutional assignable sf)
Regression Model for EHS Expenditures for AAHC Institutions, n=31 ln (EHS expenditures) = 1.587 + 0.8397 * ln (total institutional assignable sf)
Applying the Models: An Example • Consider an institution with 5 million total institutional net assignable square feet and $900 million in total annual institutional expenditures • Since we don’t know lab density, assume $0.30/sqft = $1,500,000 • Based on prediction models from Vital Statistics project: • EHS expenditures = $1,568,967 • EHS staffing = 16.7 FTE • If that same university was an AAHC institution • EHS expenditures = $2,064,581 (31% increase) • EHS staffing = 22.9 FTE (37% increase) Our data suggests an average of 30% of total expenditures is research expenditures at AAHC institutions, so (0.30)($900 million) = $270M 0.008 x $270M = $2,160,000
Forewarning • Note, even an estimate for the number of EH&S staff doesn’t give us any indication about their proficiency and effectiveness • So what should we be measuring in loss prevention? • And how should we communicate what loss prevention does?
Why Metrics? “When you measure what you are speaking about, and express it in numbers, you know something about it; but when you cannot measure it, when you cannot express it in numbers, your knowledge is of a meager and unsatisfactory kind.” William Thomson, Lord Kelvin
“If you can’t measure it, you can’t manage it”“If you don’t measure it and display it, you will soon be replaced by someone who can” Emery
Metrics What measures? What units? How often to collect the data? How to communicate the information?
Measures versus Metrics A metric is a unit of measurement that objectively quantifies an organization’s performance
Measurements as Indicators Output - workload number of individuals trained surveys or inspections completed violations assessed Outcomes – does the program achieve its desired results is safety training or inspections effective in reducing injury or illnesses
Measures for Compliance Versus Performance • For regulatory purposes we document… • Pounds of hazardous waste • If a person is trained • If a person was hurt • For performance purpose we should document… • Number of pick ups • How many people were trained • How many people were hurt and what caused the injury
Losses Personnel Property Financial Expenditures Revenues Compliance External Internal Client Satisfaction External Internal What Measures and Metrics?
What Units? $ (Cost) Square feet Time Number of events
Biological Safety Individuals trained Laboratory inspections Deficiencies identified and resolved Incident response to biological agents Biological Safety Cabinet verifications Institutional Biosafety Committee protocols
Chemical Safety Individuals trained Laboratories inspections Deficiencies identified and resolved Incident response to chemical agents Chemical fume hood verification
Radiation Safety Individuals trained Laboratory inspections Dosimetry Bioassays Instrument calibrations
Environmental Protection Disposal costs Waste weights or volumes Effluents released Cost avoidance
How Often? “Smell the cheese often so you know when it is getting old.” – Spencer Johnson Ongoing metrics communicate the effectiveness of processes “Every time you get the chance” – Emery
Communicating Metrics Focus on outcome metrics not output Select emerging issues and opportunities to communicate Report on strategic goals Remember to tie it to the mission of the organization
Caveat “Not everything that can be counted counts, and not everything that counts can be counted” - Albert Einstein