Download
1 / 59
1.16k likes | 2.41k Vues
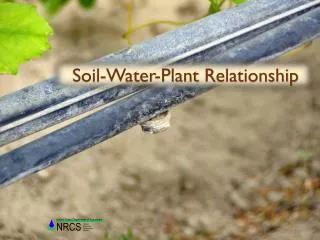
United States Department of Agriculture. NRCS. Natural Resources Conservation Service. Soil-Water-Plant Relationship. Soils. Check the following Texture Structure Intake Salt Water holding capacity ***Lateral movement. Soil Components. Air. V g. Water. V p = V g + V w. V w.

E N D
United States Department of Agriculture NRCS Natural Resources Conservation Service Soil-Water-Plant Relationship
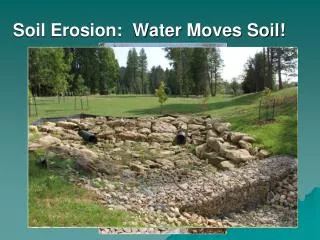
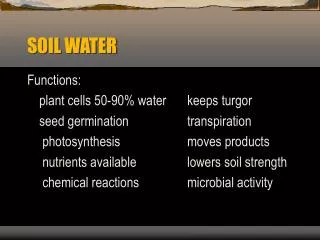
Soils • Check the following • Texture • Structure • Intake • Salt • Water holding capacity • ***Lateral movement
Soil Components Air Vg Water Vp = Vg + Vw Vw V Soil Particles Vs V = Soil Volume Vg = Volume of air Vw = Volume of water Vs = Volume of Soil Particles Vp = Volume of Soil Pores
Soil Water Saturation Gravitational Water, rapid drainage Field Capacity MAD Capillary Water, very slow drainage TAW Permanent Wilting Point Hydroscopic Water, essentially no drainage Oven Dry
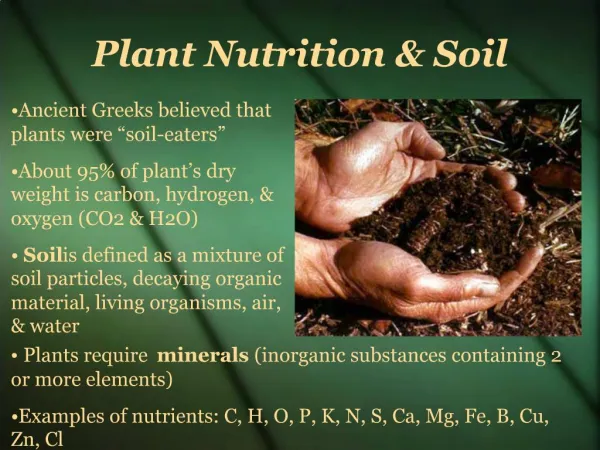
Available Water Capacity • Available water capacity - the amount of water that a soil can store that is available for use by plants. • Field capacity – amount of water left after free water has drained because of gravity. ~1/3 bar potential • Permanent wilting point – soil water content at which most plants cannot obtain sufficient water to prevent tissue damage. ~15 bars potential
Available Water Holding Capacity • Limits the amount of water that can be applied at any one irrigation . • For a given crop determines frequency of irrigations
Review Given: Root zone = 3.5 ft, WHC = 1.6”/ft, MAD = 40%, Pw =50% Find: Available water
Solution AW =RZ * WHC * MAD * Pw = 3.5*1.6*.4 *.5= 1.2 inches
Salinity • All irrigation waters have salts • Three potential problems • Salt can accumulate in the soil • Certain types of salt cause surface sealing and poor infiltration • Specific types of salts are highly toxic to plants even in low concentrations • Soil and water chemistry should always be examined before doing an irrigation design
Lateral movement • What affect lateral movement: • Varying soil textures throughout a field (e.g., sand vs. loam vs. clay). • Varying installation depths of the tape. • Varying soil compaction or stratification. • Different soil chemistry conditions • Beginning soil moisture
Percent Wetted Area • Pw is the “average horizontal area wetted in the top 6 to 12 inches of the root zone as a percentage of the total crop area.” (NEH 623, Ch. 7) For a lone tree Pw=Aw/Arz Root zone Emitter Aw Tree trunk Surface area wetted Arz Actual area wetted
Percent Wetted Area and emitter spacing Sw e = # ofemitters/tree Se = emitter spacing Sp = plant spacing Sr = row spacing Sw = diameter of the circular area wetted by a single emitter Se Sp Sr
Desired wetted area • For widely spaced crops such as vines, bushes, and trees, a reasonable design objective is to wet at least one-third and up to one-half of the horizontal cross-sectional area of the root system. • smaller Pw is favored for economic reasons. • rows spaced less than 6 ft. (1.83 m) apart, the Pw may approach 100 %.
Soil wetted area 1 Based on an emitter flow rate of 1 gph (3.785 L), the estimated Aw is given as a rectangle with the wetted width (Sw) equal to the maximum expected diameter of the wetted circle and the optimum emitter spacing (S’e) equal to 80 percent of that diameter.
Factors affecting wetted area • Lower application rates gives best horizontal water distribution • Wet soil gives the narrowest water distribution • Management can provide only minor improvement in water distribution • Soil texture is the primary determinate factor
Crop ET/System flow rate • Water requirement • MAD/stress – Root zone • Salt Tolerance – leaching requirement • Frequency
Water use ETc = ETo x Kc Where: ETc = Crop Evapotranspiration rate, in/day, (mm/day) ETo = Reference evapotranspiration, ETo or ETr, in/day, (mm/day) Kc = Crop coefficient for specific crop References (NEH Chapter 2 Irrigation water requirements, irrigation Guide)
ET for Trees • Big tress need more water than small trees • Mature tress on close spacing need same amount of water per acre as large trees on wider spacing • So if there is several blocks of the same type of tree using the same flow rate per tree, but on different spacing. Each block needs to be design for a different number of hours per week.
Pruning – if the same percent canopy cover exists on two blocks of the same type of plant – use the same ET • “Percent canopy cover” is defined as % of ground surface shaded at noon. • Cover crop come in all sizes shapes and types and may have an additional ET component – upwards 15 - 20% • For cover crop grown all season long, the micro/drip system needs to be a microspray that wets a large percentage of the surface area
Drip systems – • the ground surface is moist almost all the time which increase evaporation • The small frequent irrigations contribute to little or no plant stress • These two factors may increase the ET by as much 15% above published rates.
Designing for less than Peak ET • Regulated Deficit Irrigation (RDI) • Wine grapes (increase sugars) • Almonds (start of hull split) • Tomatoes (increase solids) • Regulate early growth of trees and vines ( trying to avoid spindly mature trees)
Frequency • Maximum Frequency Example: AWC(MAD)=1.2, ETc=0.30 Is MAD still applicable with a drip system?
Net Application NIR = ETc * f - Pe e. g. If f = 2 days, ETc =.3”/day, and Pe=0.0 Then NIR =.6”
Considerations on Published ET • Loam or heavier textured soil with at least 60% wetted volume • Design for the peak month of a normal year • Situations of low soil water capacity • Design flow rates may need to be 10 -15% higher • Low water holding capacities are caused by: • Small percentage wetted area • Sand or rocky soils • Shallow soils • Shallow root systems (e.g. avocadoes or some produce crops)
Transpiration ratios - Unavoidable losses Table 7-15. Seasonal transpiration ratios for arid and humid regions with various soil textures and rooting depths. 1Seasonal transpiration ratios (TR) are for drip emitters. For spray emitters add 0.05 to TR in humid climates and 0.10 in arid climates
Emission Uniformity – Distribution Uniformity • is a mathematical expression used to quantify differences in the amount of water received by the plants throughout the field
Emission Uniformity Poor EU Good EU
Emission/Distribution Uniformity What’s the highest EU that you can have?
Actual vs. Potential EU • Actual EU’s are lower than the Potential and are dependent on the following – • System Design • Suitability • Management
EU Deteriorate with time • Allowable pressure difference determined by brand new design EU • Required system capacity by estimated EU after several years
What can cause Poor EU? • Pressure Differences • Uneven spacing • Unequal drainage • Other • Plugging etc. • Wear
Leaching ratio • LR is the faction of applied water required to maintain a desired salinity level in the soil at the spot that receives just enough water to match ET • The complete LR may be satisfied by rainfall in some areas
Gross application • Gross amount of water to be applied at each irrigation, (Fg), (in.), includes sufficient water to compensate for the system non-uniformity and unavoidable losses, and to provide for salt leaching