Download
1 / 22
420 likes | 2.15k Vues
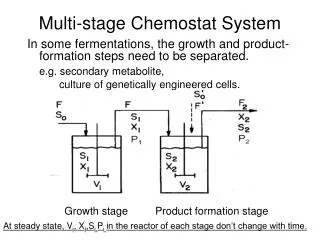
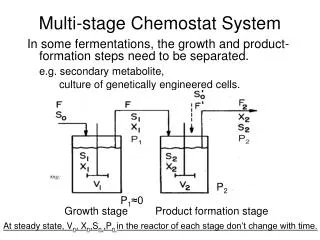
P 2. P 1 ≈0. Multi-stage Chemostat System. In some fermentations, the growth and product-formation steps need to be separated. e.g. secondary metabolite, culture of genetically engineered cells. Growth stage. Product formation stage.

E N D
P2 P1≈0 Multi-stage Chemostat System In some fermentations, the growth and product-formation steps need to be separated. e.g. secondary metabolite, culture of genetically engineered cells. Growth stage Product formation stage At steady state, Vn, Xn,Sn,,Pn in the reactor of each stage don’t change with time.
Multi-stage Chemostat System X0=0, Vi, i=1,2….n constant. Stage 1: cell growth condition, Kd=0, qp=0 Cell mass: At steady state Limiting substrate: At steady state
Multi-stage Chemostat System P2 P1≈0 Stage 2 – product formation conditions, Kd=0, F’=0 Cell mass: ‘ At steady state F V2 are constant.
Multi-stage Chemostat System Stage 2 – product formation conditions, Kd=0, F’=0 Limiting substrate: At steady state Product: At steady state
Multi-stage Chemostat System Stage n – product formation conditions, Kd=0, F’=0 Similarly, equations could be obtained for nth stage. If μn (e.g. Monod model) and qp are known functions, Xn , Pn, and Sn at nth stage could be determined by the above equations.
Multi-stage Chemostat System To determine the parameters (X, P) graphically when growth kinetics cannot be expressed analytically. With no additional streams added to the second or subsequent units, mass balance around the nth stage on cell, substrate and product yields rx,n: cell growth rate at nth stage (g/l-h); F: the volumetric flowrate (l/h); Dn=F/Vn: the dilution rate at the nth stage (1/h); Vn: the liquid volume of the nth chemostat (l)
Multi-stage Chemostat System Similarly at steady state rp,n: product formation at nth stage (g/l-h); rs,n: substrate consumption at nth stage (g/l-h);
Multi-stage Chemostat System To determine the parameters (X, P) graphically. For an example, in a two-stage chemostat system, the first tank is 600 l and the second one is 900 l. The flowrate is 100l/h, determine the concentrations of cells and product in each of the tank. Solution: - Get kinetics data (X~t, P~t) from the batch culture. originating from (Pn-1, 0).
To determine the parameters (X, P) graphically in multi-stage chemostat system Get the kinetics data of X~t and P~t from batch culture and plot Get dX/dt~X from the kinetics data and plot Determine X1 and P1 in the first stage: On the graph of dX/dt~X, draw a line of y=D1 (X1 -X0) D1=F/V1, X0=0 in the feed, X1 is determined from the intersection. On the graph of X,P~t, P1 is determined by the X1 at the respect time Determine X2 and P2 in the second stage: Plot the graph of dP/dt~P from the kinetics data of P, draw a line of y=D2(P2-P1), D2=F/V2 , P2 is determined from the intersection. On the graph of X,P~t, X2 is determined by the P2 at the respect time.
dX/dt (g/L-h) X (g/L)
To determine the parameters (X, P) graphically in a multi-stage chemostat system Get the kinetics data of X~t and P~t from batch culture and plot Get dX/dt~X from the kinetics data and plot Determine X1 and P1 in the first stage: On the graph of dX/dt~X, draw a line of y=D1 (X1 -X0) D1=F/V1, X0=0 in the feed, X1 is determined from the intersection. On the graph of X,P~t, P1 is determined by the X1 at the respect time Determine X2 and P2 in the second stage: Plot the graph of dP/dt~P from the kinetics data of P, draw a line of y=D2(P2-P1), D2=F/V2 , P2 is determined from the intersection. On the graph of X,P~t, X2 is determined by the P2 at the respect time.
Multi-stage Chemostat-Graphical Solution dX/dt (g/L-h) X (g/L) - Get data of dX/dt~X from the kinetics data in the batch culture and plot. y=0.167X1 x1 is 7.1g/l • Determine the x1 in the first stage of chemostat. On the graph of dX/dt~X, draw a line of originating from (X 0 , 0). x1 can be found from the intersection.
To determine the parameters (X, P) graphically in a multi-stage chemostat system Get the kinetics data of X~t and P~t from batch culture and plot Get dX/dt~X from the kinetics data and plot Determine X1 and P1 in the first stage On the graph of dX/dt~X, draw a line of y=F/V1 (X1 -X0) X0=0 in the feed, X1 is determined from the intersection. On the graph of X,P~t, P1 is determined by the X1 at the respect time Determine X2 and P2 in the second stage Plot the graph of dP/dt~P from the kinetics data of P, draw a line of y=F/V2(P2-P1), P2 is determined from the intersection. On the graph of X,P~t, X2 is determined by the P2 at the respect time.
Multi-stage Chemostat-Graphical Solution - From the graph of kinetics data get the P1 in respect with the X1. X1=7.1 g/l P1=0.09 g/l
To determine the parameters (X, P) graphically in a multi-stage chemostat system Get the kinetics data of X~t and P~t from batch culture and plot Get dX/dt~X from the kinetics data and plot Determine X1 and P1 in the first stage On the graph of dX/dt~X, draw a line of y=F/V1 (X1 -X0) X0=0 in the feed, X1 is determined from the intersection. On the graph of X,P~t, P1 is determined by the X1 at the respect time Determine X2 and P2 in the second stage Plot the graph of dP/dt~P from the kinetics data of P, draw a line of y=F/V2(P2-P1), P2 is determined from the intersection. On the graph of X,P~t, X2 is determined by the P2 at the respect time.
Multi-stage Chemostat-Graphical Solution • Determine the X2 and P2 For the second stage. X1=7.1 g/l P1=0.09 g/l
To determine the parameters (X, P) graphically in a multi-stage chemostat system Get the kinetics data of X~t and P~t from batch culture and plot Get dX/dt~X from the kinetics data and plot Determine X1 and P1 in the first stage On the graph of dX/dt~X, draw a line of y=F/V1 (X1 -X0) X0=0 in the feed, X1 is determined from the intersection. On the graph of X,P~t, P1 is determined by the X1 at the respect time Determine X2 and P2 in the second stage Plot the graph of dP/dt~P from the kinetics data of P~t, draw a line of y=F/V2(P2-P1), P2 is determined from the intersection. On the graph of X,P~t, X2 is determined by the P2 at the respect time.
Multi-stage Chemostat-Graphical Solution dP/dt (g/L-h) y=0.111(P2-0.09) P (g/L) P1=0.09 g/l P2=0.53 g/l • on the graph of dP/dt ~ P, draw a line of • Determine the X2 and P2 For the second stage. -get dP/dt ~ P from the kinetics data in the batch culture and plot. P2 can be determined from the intersection.
To determine the parameters (X, P) graphically in a multi-stage chemostat system Get the kinetics data of X~t and P~t from batch culture and plot Get dX/dt~X from the kinetics data and plot Determine X1 and P1 in the first stage On the graph of dX/dt ~X, draw a line of y=F/V1 (X1 -X0) X0=0 in the feed, X1 is determined from the intersection. On the graph of X,P~t, P1 is determined by the X1 at the respect time Determine X2 and P2 in the second stage Plot the graph of dP/dt~P from the kinetics data of P, draw a line of y=F/V2(P2-P1), P2 is determined from the intersection. On the graph of X,P~t, X2 is determined by the P2 at the respect time.
X1=7.1 g/l X (g/L) P1=0.09 g/l Time (hr) Multi-stage Chemostat-Graphical Solution - From the graph of kinetics data get the X2 in respect with the P2 X2=7.95 g/l P2=0.53 g/l - Similarly, Xn and Pn can be determined for the nth stage of reactor.
X=7.5g/l X (g/L) P (g/L) dX/dt (g/L-h) y=0.067X P=0.14g/l X=7.5g/l X (g/L) Time (hr) Multi-stage Chemostat-Graphical Solution In summary, the first tank is 600 l and the second one is 900 l. The flowrate is 100l/h, X1=7.1 g/l, P1=0.09 g/l; X2=7.95 g/l, P2=0.53 g/l If one stage chemostat is used with the same total working volume i.e. 1500 l as that in the above example. The flowrate is also 100l/h. What is the achieved concentrations of the cells and the product? D=F/V=100/1500=0.067 (h-1) Product concentration can be increased by using multistage chemostats instead of single stage with the same total reactor working volume. Ex.9.2
Problems for Practice Textbook (M.Shular) Q: 9.3: • You are not required to determine the configuration of tanks that would maximize product formation. Instead, determine the concentration of the product in each tank for the following configurations using the graphical method introduced in the lecture: • Reactor 1 (600 L), reactor 2 (900L) and reactor 3 (300 L). • Reactor 1 (900 L), reactor 2 (300L) and reactor 3 (600 L). • Which of the above configurations gives higher product concentration? • If 300 L reactor is the first reactor in series, what would happen? Q: 9.4 Ex.9.1-9.2