Moist adiabatic processes on a thermodynamic chart.
200 likes | 392 Vues
Moist adiabatic processes on a thermodynamic chart. Atms Sc 4310 / 7310 Lab 3 Anthony R. Lupo. Moist adiabatic processes on a thermodynamic chart. Last time we examined dry adiabatic processes Now examine moist processes (saturation!)

Moist adiabatic processes on a thermodynamic chart.
E N D
Presentation Transcript
Moist adiabatic processes on a thermodynamic chart. Atms Sc 4310 / 7310 Lab 3 Anthony R. Lupo
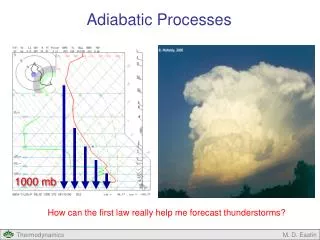
Moist adiabatic processes on a thermodynamic chart. • Last time we examined dry adiabatic processes • Now examine moist processes (saturation!) • moist adiabats are lines of moist potential temperature, read; Bluestein, pp 201 – 211..
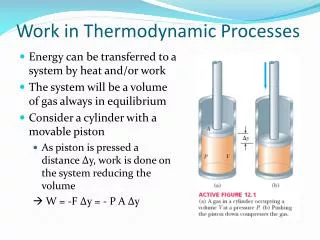
Moist adiabatic processes on a thermodynamic chart. • Mixing ratio: Mv (mass of vapor) _______________ Md (masss of dry air) • Thermodynamics of dry air air without any form of water. • Moist air dry air + water vapor.
Moist adiabatic processes on a thermodynamic chart. • Let: Md = mass of dry air (N2, O2 etc.) • Then: Mv (is the mass of water vapor) • Note: you may see Ml (liquid) or Mi (ice) in this class or in other classes.c
Moist adiabatic processes on a thermodynamic chart. • The mixing ratio (m) (r) general definition: • m = Mass of trace substance / mass of fluid • so, using water vapor m, • but ml or mi can also be defined
Moist adiabatic processes on a thermodynamic chart. • The specific humidity • (q) = Mv / Md + Mv • Recall “fun fact” from Atms. 50 • Water vapor constitutes near 0 to up to 4%, water vapor (usually about 1%)
Moist adiabatic processes on a thermodynamic chart. • Thus, for most situations: “m” roughly equals “q” • Mixing ratio (m) of air is the actual mixing ratio (and is associated with the dewpoint) • Saturated mixing ratio (ms) mixing ratio the air would have at the ambient temperature if it was saturated.
Moist adiabatic processes on a thermodynamic chart. • Vapor pressure partial pressure of water (Dalton’s Law) • Thus the ideal gas law for dry air is • P – e = rd Rd T
Moist adiabatic processes on a thermodynamic chart. • Relate mixing ratio (m) to vapor pressure (e) ! • Relative humidity:
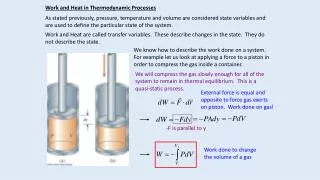
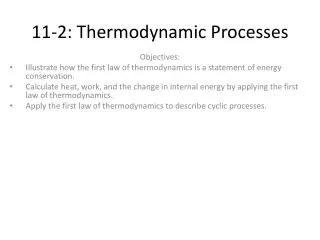
Moist adiabatic processes on a thermodynamic chart. • Equivalent Potential Temperaure: Moist adiabats • Let’s derive! • 1st law:
Moist adiabatic processes on a thermodynamic chart. • What to do? Let’s • 1. substitute in pa = RT • 2. “parameterize” the Latent Heat Release:
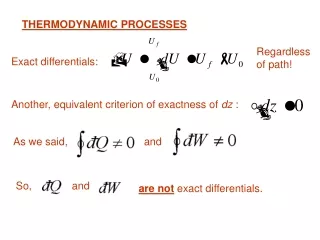
Moist adiabatic processes on a thermodynamic chart. • This becomes equation (1) • OK, let’s leave this alone and look at:
Moist adiabatic processes on a thermodynamic chart. • Take natural log: • Take the derivative of this, and “a little” algebra to get equation (2):
Moist adiabatic processes on a thermodynamic chart. • Hmm…. The RHS of eq. (1) and (2) are the same, so: • Then apply “the snake”
Moist adiabatic processes on a thermodynamic chart. • After integrating, a bit o’ algebra, and assuming: • 1) ws / T 0 • 2) qo = qe • we get moist potential temperature!
Moist adiabatic processes on a thermodynamic chart. • Virtual temperature • When air is inherently moist, if we could take into account the effect of moisture and get a temperature the air would have if it were dry: • p = rd Rd T + rv Rv T • p = r R T = r Rd Tv • where Tv is the Virtual temperature.
Moist adiabatic processes on a thermodynamic chart. • We can calculate using “brute force” • Tv = (1 + 0.609m)T • where T = Kelvins and m is kg / kg or a unitless number!!
Moist adiabatic processes on a thermodynamic chart. • Or, the shortcut (graphical) method: • Tv = T + (ws / 6) • where T is degrees C and ws is g/kg
Moist adiabatic processes on a thermodynamic chart. • Questions? • Comments? • Criticisms?
Moist adiabatic processes on a thermodynamic chart. • The end!