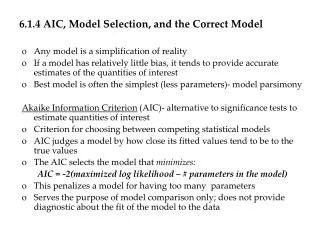
GISWR: Témez Model
GISWR: Témez Model. Application with GIS. Antonio Cañamás Catalá. Objectives. Research the different GIS Databases for Spain Apply Témez Model in a Discuss whether the model is representative of the behavior of the Watersheds


GISWR: Témez Model
E N D
Presentation Transcript
GISWR:Témez Model Application with GIS Antonio Cañamás Catalá
Objectives • Research the different GIS Databases for Spain • Apply Témez Model in a • Discuss whether the model is representative of the behavior of the Watersheds • Possible applications of the model: streamflow prediction with different scenarios; pumping, climate change… Spanish Watershed U.S. Watershed
Témez Model • Rainfall-Runoff Model: uses Mass Balance • Data necessary: • Monthly Time Series for the last 25-30 years P, Streamflow, PET Linear Reservoir Model Variables of the model to approximate the behavior: c, Hmax, Imax, α
Location of the Watersheds Surface = 1396 km2 Surface = 921.16 km2
Data Sources Amount of evapotranspiration that would occur if enough water was available. Thornthwaite Formula: L mean daylight hours of the month N no. of days in the month Ti mean monthly temperature I parameter that depends on Ti α parameter that depends on I
RESULTS Spanish Watershed U.S. Watershed
Spanish Watershed Calibration minimize the difference between observed and calculated Bad approx. to peaks
Spanish Watershed Starting to work accurately More data needed!!! November is a month with often peak flows Biggest difference!!!
U.S Watershed Bad approx. to peaks Flood July 2002
U.S Watershed Trying to figure out why these big differences in some months Good approx. to base flows May….
Discuss the results for the U.S Watershed • Run a Climate change or Pumping simulation or both and analyze the results… (a period of time) Reduce in P and Increase in PET Aquifer Recharge - Pumping
Acknowledgements Gonzalo Espinoza Dr. David Maidment