Download
1 / 1
10 likes | 147 Vues
Validating an animal model of attention deficit hyperactivity disorder: neural and behavioral correlates of impulsivity in rats prenatally exposed to nicotine Team RITALIN: Research In Testing ADHD’s Link to Impulsivity in Neuroscience

E N D
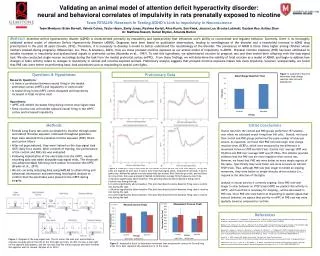
Validating an animal model of attention deficit hyperactivity disorder: neural and behavioral correlates of impulsivity in rats prenatally exposed to nicotine Team RITALIN: Research In Testing ADHD’s Link to Impulsivity in Neuroscience Team Members: Brian Barnett, Valerie Cohen, Taylor Hearn, Emily Jones, Reshma Kariyil, Alice Kunin, Sen Kwak, Jessica Lee, Brooke Lubinski, Gautam Rao, Ashley Zhan Dr. Matthew Roesch, Daniel Bryden, Amanda Burton AbstractAttention-deficit hyperactivity disoder (ADHD) is characterized primarily by impulsivity and hyperactivity that influences one’s ability to concentrate and regulate behavior. Currently, there is no thoroughly validated animal model of Attention Deficit Hyperactivity Disorder (ADHD). Diagnoses have been based on qualitative observations, leading to overdiagnosis of the disorder and a twentyfold increase in ADHD drug prescriptions in the past 30 years (Sroufe, 2012). Therefore, it is necessary to develop a model to better understand the neurobiology of the disorder. The prevalence of ADHD is three times higher among children whose mothers smoked during pregnancy (Wasserman, Liu, Pine, & Graziano, 2001), thus we chose prenatal nicotine exposure as our animal model of impulsivity in ADHD. Prenatal nicotine exposure (PNE) has been attributed to notable increases in impulsivity and dysfunctional signals in prefrontal cortex (Muneoka et al., 1997). To test this hypothesis, we administered nicotine to pregnant rats and then tested their offspring with the stop-signal task. We also conducted single-neuron recordings during the task from the medial prefrontal cortex (mPFC). From these findings, we will determine the validity of fetal nicotine as a model of ADHD, and begin to address how changes in brain activity relate to changes in impulsivity in normal and nicotine exposed animals. Preliminary analysis suggests that prenatal nicotine exposure makes rats more impulsive, however, unexpectedly, we found that PNE rats were better at performing basic task procedures such as responding to spatial cues lights. Figure 4. Analyzed in Excel to determine stop change reaction time for both populations. • Questions & Hypotheses • Research Questions: • Is there a correlation between neural firing in the medial prefrontal cortex (mPFC) and impulsivity in control rats? • Is neural firing in the mPFC cortex disrupted and impulsivity increased in fetal nicotine rats? • Hypotheses: • mPFC will exhibit increased firing during correct stop-signal trials • Fetal nicotine rats will exhibit reduced neural firing in the mPFC cortex and increased impulsivity Preliminary Data • Methods • Female Long Evans rats were acclimated to nicotine through water and mated; Nicotine exposure continued throughout gestation. • Pups were selected from prenatal nicotine exposure (PNE) litters and control litters • After rat pups matured, they were trained on the stop-signal task (SST) daily for a month. After a month of training, the performance of the control and PNE rats was evaluated. • Following implantation of the electrodes into the mPFC, neural recording data was taken alongside stop-signal trials. The electrode was advanced 40µm following each session to traverse the mPFC (Bryden et al., 2011). • We are currently analyzing data using MATLAB to obtain firing and behavioral information and performing histological analysis to confirm that the electrodes were placed in the mPFC during surgery. Initial Conclusions Twelve rats from the control and PNE groups performed 157 sessions, over which we collected neural firing from 346 cells. Overall, we found that control and PNE groups performed the same number of trials per session. As expected, we found that PNE rats had longer stop change reaction times (SCRTs), which were measured by the difference in movement times on STOP and GO trials. Control rats’ average SCRT was 78.67ms and PNE rats’ average SCRT was 97.78ms. This statistic provides evidence that the PNE rats are more impulsive than control rats. However, we found that PNE rats were better on more simple aspects of the tasks. Specifically, they were faster and more accurate on GO and STOP trials. Thus, although PNE rats took longer to inhibit an ongoing movement, they were better at simple stimulus driven actions (i.e., respond in the direction of the light). Analysis of neural activity is currently ongoing. Since PNE rats took longer to alter behavior on STOP trials (SCRT) we predict that activity in mPFC, which we think is necessary for stopping,, will be decreased in PNE rats. Since PNE rats were better at responding to spatial signals that instruct behavior, we expect that activity in mPFC of PNE rats was more spatially tuned as compared to controls. Figure 2. Baseline firing is described as the neural activity before the trial time begins. Firing rate plots are aligned on port exit. X-axis is time from stop-signal onset, measured in seconds. Y-axis is spike rate, defined as spikes or action potentials per second. Blue lines are go trials, and red lines are stop trials. Data was analyzed in Matlab to determine average firing frequency over time.a) Nicotine significantly above baseline. This plot describes the above baseline firing rate in nicotine rats during the task. b) Control significantly above baseline. This plot describes the above baseline firing rate in control rats during the task. c) Nicotine significantly below baseline This plot describes the below baseline firing rate in nicotine rats during the task.d) Control significantly below baseline. This plot describes the below baseline firing rate in control rats during the task. References Bryden, D. W., Burton, A. C., Kashtelyan, V., Barnett, B. R., & Roesch, M. R. (2012). Response inhibition signals and miscoding of direction in dorsomedial striatum. Front Integr Neurosci, 6, 69. doi: 10.3389/fnint.2012.00069 Bryden, D. W., Johnson, E. E., Diao, X., & Roesch, M. R. (2011). Impact of expected value on neural activity in rat substantia nigra pars reticulata. European Journal of Neuroscience, 33(12), 2308-2317. doi: 10.1111/j.1460-9568.2011.07705.xMuneoka, K., Ogawa,T., Kamei, K., Muraoka, S., Tomiyoshi, R., Mimura, Y., … Takigawa, M. (1997). Prenatal nicotine exposure affects the development of the central serotonergic system as well as the dopaminergic system in rat offspring: involvement of route of drug administrations. Developmental Brain Research, 102(1), 117-126. doi: 10.1016/S0165-3806(97)00092-8. Sroufe, A. L. (2012, January 28). Ritalin Gone Wrong. The New York Times. Retrieved from http://www.nytimes.com/2012/01/29/opinion/sunday/childrens-add-drugs-dont-work-long-term.html?_r=1&pagewanted=allWasserman, G. A., Liu, X., Pine, D. S., & Graziano, J. H. (2001). Contribution of maternal smoking during pregnancy and lead exposure to early child behavior problems. Neurotoxicology and Teratology, 23(1), 13-21. doi: S0892-0362(00)00116-1 Figure 1. Diagram of the stop-signal task. The rat enters the odor port and initiates a response towards well on the side of the first light (go trial). On 20% of trials, a stop light on the opposite side appears, and the rat must stop the initial response and move towards the opposite well for reward. (Bryden et al, 2012) Figure 3. Analyzed in Excel to determine movement time and percent correct for Go and Stop trials. Error bars represent the standard error of the mean.