Download

1 / 37
390 likes | 673 Vues
Architecture of Colliding Tectonic Plates in Tibet by Passive Source Seismology Junmeng Zhao Institute of Tibetan Plateau Research, Chinese Academy of Sciences. Acknowledgments: Research : Hongbing Liu, Shunping Pei, Lin Ding, Xing Gao, Qiang Xu, Wei Wang ( Institute

E N D
Architecture of Colliding Tectonic Plates in Tibet by Passive Source Seismology Junmeng Zhao Institute of Tibetan Plateau Research, Chinese Academy of Sciences Acknowledgments: Research: Hongbing Liu, Shunping Pei, Lin Ding, Xing Gao, Qiang Xu, Wei Wang (Institute of Tibetan Plateau Research, CAS) Xiaohui Yuan, Prakash Kumar, Rainer Kind (Potsdam, Germany) Zhongjie Zhang and Jiwen Teng (Institute of Geology and Geophysics, CAS) Research Funding: Talent Project, CAS; Innovation Project CAS; NNSF
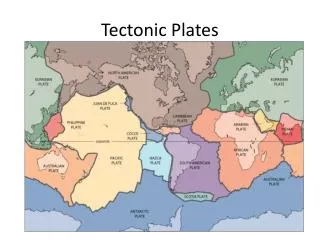
The uplifting of the Tibetan Plateau is one of the most important tectonic events in geoscience since Meso-Cenozoic. It affects global climate change, especially the northern semi-sphere. The Third Pole The crust and mantle structure and the activities control the formation and evolution of the entire geodynamic regime.
Kind et al., 2002 Kumar et al., 2006 Question Why one plateau, more models? Some models for Tibetan Plateau uplifting
° ANTILOPE (ArrayNetworkofTibetanInternationalLithosphericObservationandProbeExperiments)
ANTILOPE progress till 2010 ANTILOPE-I ANTILOPE-II ITPCAS Array Sections will be finished in 2009
Bad traffic condition Instruments were carried to assigned position by horses Tutoring at night for a Tibetan student (middle) in a tent at 5300m high Donation to a Tibetan school
Seismic Wave Propagation Receiver Array (seismometers) Source (Earthquake)
Architecture of Colliding Tectonic Plates in Tibet 478 teleseismic earthquakes of high signal∕noise ratio have been recorded and used for receiver function analysis. 7421 P receiver functions from 354 events at epicentral distances of 30–95° 3476 S receiver functions [including core phase (SKS) receiver functions] from 249 events at epicentral distances of 60–115° A map showing teleseismic events used for calculation of P and S receiver functions
Architecture of Colliding Tectonic Plates in Tibet Distribution of events with incidence angles estimated by minimizing the SV amplitudes on the P-component of seismograms. We have kept a threshold incidence angle of 52° and beyond that the events were rejected due to possible contamination by high noise level. For nearly 94% of total events the incidence angles determined are less than 30°, a reasonable range of S wave incidence angles.
Location and Data of ANTILOPE-I、II Map of seismic stations (black triangles) of the two recent profiles. Black lines denote major sutures and faults. Crosses denote surface projection of the P-to-S conversion points (piercing points) at different depths. Yellow circles are piercing points of the S-to-P conversions at the LAB depth. (Zhao et al.,2010 PNAS) ANTILOPE-I ANTILOPE-II
S wave receiver functions of ANTILOPE-I Positive amplitudes are coded red, indicating an increasing velocity jump with depth, and vice versa. The Moho and LAB phases are marked by dashed lines. ANTILOPE-I 羚羊-I 羚羊-II Location of ANTILOPE-I S wave receiver functions, sorted by piercing points at the 150 km conversion depth. LAB (Zhao et al., 2010)
S wave receiver functions of ANTILOPE-II Positive amplitudes are coded red, indicating an increasing velocity jump with depth, and vice versa. The Moho and LAB phases are marked by dashed lines. 羚羊-I 羚羊-II ANTILOPE-II S receiver functions, sorted by piercing points at the 150 km conversion depth. LAB ? (Zhao et al., 2010)
P wave receiver functions of ANTILOPE-I Positive amplitudes are plotted in red, negative in blue. The dashed lines follow the observed phases of the 410 and 660 km discontinuities.The blue and greenlines indicate the positions of Indian and Asian plates determined by S wave receiver functions, respectively. ANTILOPE-I Locations of the profiles Upper mantle transitional zone Behavior of upper mantle transitional zone when disturbed (Zhao et al., 2010) ANTILOPE-I
P wave receiver Functions of ANTILOPE-II ANTILOPE-II Locations of the profiles ANTILOPE-II Behavior of upper mantle transitional zone when disturbed The blue and red lines indicate the positions of Indian and Asian plates determined by S wave receiver functions, respectively. (Zhao et al., 2010)
P wave receiver functions of INDEPTH INDEPTH Location of the profile Upper mantle transitional zone INDEPTH The blue, red and green lines indicate the positions of Indian, Tibetan and Asian plates determined by S wave receiver functions, respectively. Behavior of upper mantle transitional zone when disturbed
Comparison of the transitional zones along four lines in Tibet ANTILOPE-I ANTILOPE-II INDEPTH LMS Line An exception would be eastern Tibet at the border of the Sichuan Basin (LMS line ), where lithospheric delamination, possibly acompanied by a vertically asthenospheric flow, may change the equilibrium status of the mantle transition zone. Therefore eastern Tibet seems the only region in our data, where plate tectonics is reaching the mantle transition zone.
Seismic anisotropy along ANTILOPE-II Figure4. Rose diagram of each station showing the measurements calculated by the cross-correlation method. The concentric circles are scales. The diameter of the big one is 2 second and the small one 1 second. The number under each circle is number of the seismic station with 3 in the southern end and 66 as the northern end. The straight lines in rose diagrams are measurements of seismic anisotropy calculated by the cross-correlation method. The length stands for the delay time and direction of the straight line stands for the fast polarization direction.
Seismic anisotropy along ANTILOPE-II A) the elevation. B) The delay times. C) The green segment orientation shows the direction of station’s fast wave polarization, and upward is north. D) Cartoon illustrating the collision of the Indian and Tibetan plates by summarizing the results of seismic anisotropy from shear wave splitting analysis and the result of S receiver functions along the same profile. D (Zhao et al., 2010)
Seismic anisotropy SKS anisotropy data at Tibet along the two new profiles (red) and from a collection of other papers ( blue). In south- ern and western Tibet, no or very weak anisotropy is observed. In contrast, the region in northern central and eastern Tibet, which acts like a mobile buffer zone between the colliding lithospheres, is characterized by strong anisotropy. ANTILOPE-I ANTILOPE-II (Zhao et al.,2010 PNAS)
Architecture of Colliding Tectonic Plates in Tibet TK Section A ANTILOPE-I A TK Section ANTILOPE-I A ANTILOPE-II+INDEPTH ANTILOPE-II A INDEPTH Lift: Simple cartoons showing the relationship of the Indian, Tibetan and Asian mantle lithospheres Upper:Map of the Tibetan plateau and seismic profilesTransparency colors denote the locations of the Indian, Tibetan and Asian plates. The India-Tibet boundary indicates the northern edge of the Indian plate; The Tibet-Asia boundary is partly defined by the locations of Moho offsets.Blue and Green arrows denote the dominant subduction of the Indian and Asian plates, respectively. ? LMS Section A
The boundary between the Indian andAsian tectonic plates below Tibet The west and central lines are our recent profiles. East line is a compilation of two French experiments, the INDEPTH profiles and the PASSCAL experiment from 1991–1992. The TK Line is an additional profile with LAB observations used in this paper. Blue and green bars with arrows mark LAB observations of the Indian (IML) and Asian (AML) plates, respectively. Yellow and red boxes mark observations of the upper mantle discontinuities. Red parts of these boxes mark unusually late arrivals of the converted phases from the 410 discontinuity. Black bars at the northern margins of Tibet at the west line and east line denote sharp steps in Moho depth. TK SECTION ANTILOPE-I INDEPTH ANTILOPE-II ANTILOPE-II (Zhao et al.,2010 PNAS)
Crustal Deformation Around the Tibetan Plateau(Tibetan Plateau Fixed Reference Frame) Wenchuan Eq (Gan et al. 2007, JGR)
Crustal structure of ANTILOPE-II by P wave receiver function stack YZS BNS 8km 4
S-wave velocity structure of the crust along ANTILOPE-II by waveform inversion YZS BNS
Shear wave velocity along ANTILOPE- I by ambient noise tomography
Shear wave velocity along ANTILOPE-II by ambient noise tomography
How to bridge the crust and mantle? Indian crustal intrusion? Crustal channel flow?
How to bridge the crust and mantle? Are these parts with high velocity from Indian crust?
1)印度板块和亚洲板块在青藏高原之下的碰撞边界是沿塔里木盆地西缘到喜马拉雅东构造结一线;1)印度板块和亚洲板块在青藏高原之下的碰撞边界是沿塔里木盆地西缘到喜马拉雅东构造结一线; 2)青藏高原的地壳缩短在高原南部通过印度地壳向亚洲地壳之下俯冲实现调节,在高原北部为均匀的地壳增厚所吸收; 3)青藏高原西部海拔较高、地形起伏强烈的原因是有较坚硬的岩石圈地幔的支持,而高原北部和东部岩石圈地幔较软,故地形相对平坦、较低; 4)在高原的北部和东部发现一个特殊的岩石圈区域(西藏板块),它夹持于印度板块与亚洲板块之间,具有高温、低速、高Sn波衰减和地震各向异性,在南北挤压的应力背景下该岩石圈整体向东运动,遇到四川盆地的阻挡向四个方向运动:云贵川方向、鄂尔多斯方向;向上形成龙门山,向下进入深部地幔,汶川 地震就位于该区域的东缘。 结 论
关键科学问题(1):亚洲岩石圈地幔的行为方式关键科学问题(1):亚洲岩石圈地幔的行为方式 TK Section A ANTILOPE-I A TK Section ANTILOPE-I A ANTILOPE-II+INDEPTH ANTILOPE-II A INDEPTH Lift: Simple cartoons showing the relationship of the Indian, Tibetan and Asian mantle lithospheres Upper:Map of the Tibetan plateau and seismic profilesTransparency colors denote the locations of the Indian, Tibetan and Asian plates. The India-Tibet boundary indicates the northern edge of the Indian plate; The Tibet-Asia boundary is partly defined by the locations of Moho offsets.Blue and Green arrows denote the dominant subduction of the Indian and Asian plates, respectively. ? LMS Section A
关键科学问题(2):青藏高原北东向扩展的深部 动力学机制 a a. 中下地壳拆离--逐步生长隆升模型 (Tapponnier et al., 1990;)。祁连山的隆起是由于阿尔金断裂的北东向走滑,在中下地壳形成了拆离面,该拆离面逐步向北东扩展冲断,依次导致南祁连、中祁连和北祁连山的隆起。如果该模型成立,在中下地壳应形成拆离面,亚洲岩石圈地幔向南插入祁连山下,祁连山早期的古亚洲岩石圈可能被彻底置换。 b.块体拼贴-后期同步隆升模型(Yin et al., 2000)。阿尔金断裂的北东向走滑并没有导致祁连山在中下地壳拆离,而是造成区域性的整体挤压缩短和隆升,祁连山早期的块体拼贴结构没有被破坏,仅仅是各块体沿早期拼贴缝合带再次活化。如果该模型成立,那么,南、中、北祁连山块体应该是同步隆升,幅度差别不大,早期亚洲岩石圈组成清晰可见,不需要亚洲岩石圈地幔向南插入祁连山下。 那么,青藏高原向北东方向扩展是整体抬升?还是由南而北逐渐扩展? b
观测系统 • 在ANTILOPE-IV剖面上架设100套宽频带数字地震仪,平均点距为5 km,在关键构造部位加密至3km,记录时间为1年,获得约1000Gb的高质量的地震数据;考虑到噪音成像的需要,在剖面西侧的阿尔金山西侧布设一定数量的台站,形成对研究区及周边地区有效的射线覆盖。 • 2. 沿剖面完成100个物理点的宽频带大地(MT)探测
用于背景噪音成像的观测系统及射线覆盖 由于在剖面的东部有固定台站,而剖面的西侧台站较少,考虑到噪音成像的需要,在剖面西侧的阿尔金山西侧布设一定数量的台站,形成对研究区及周边地区的有效射线覆盖图
the END Thank you!