Download
1 / 33
330 likes | 453 Vues
This talk, presented by Professor Elizabeth Deakin from UC Berkeley, delves into the complexities of urban travel and transportation modes in a future constrained by climate challenges. It explores past and present trends in travel behavior, the impact of urban planning on transit options, and the effectiveness of strategies aimed at reducing vehicle use and energy consumption. The discussion examines demographic influences, travel data, and the urgent need for integrated transportation-land use planning, emphasizing the role of policy in shaping sustainable urban environments.

E N D
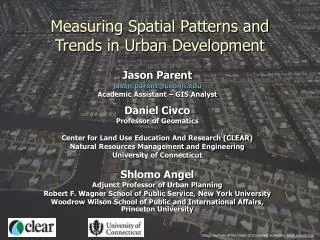
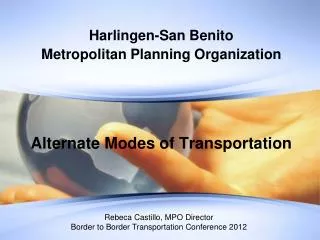
Shifting modes? Transportation and Urban Development Patterns in a Climate-Constrained Future Elizabeth Deakin Professor of City and Regional Planning University of California, Berkeley March 5, 2011
Overview of Talk • Background on travel, especially urban travel • What are the options for changing the way we travel, and how does mode choice fit in? • What has our experience been in reducing vehicle use & saving energy in transport via mode shifts? • Prospects for the future
I - Factors affecting travel and its impacts • Population and economic growth - amount of activity (scaling up in much of the world, stagnant in some places) • Share of population in workforce (~20% of personal travel is work or work-related trips and another 20% is linked to work travel) • Disposable income (affects discretionary travel for individuals, households, businesses) • Location of activities and travel options among them -- destination and mode choice • Number of routes available – affects speeds, delays, crowding
Current Travel Mode Shares (%) – Journey to Work, US (varies by region)
More data on travel • Av. no. trips per capita per day: 2.6 - 3.1 • Av. time spent traveling: ~ 1 hr a day • Av. trip lengths: 20-25 min. time, distances vary • Work: 11-12 mi. • Shopping, personal business ~ 5-7 mi • Share of trips that are linked to other trips: ~ 1/3 • For men: no stops on way home ~ 80% • For women: no stops on way home ~ 39% • Share of trips less than 50 mi: ~ 98%
Trends in VMT 1970-2010 • 3 billion miles a mo • Flattening out last few years: recession, prices, aging population, ….???? • Transit ridership has increased overall but declined or stayed flat as share of trips
Rising VMT threatens to overwhelm GHG savings from cleaner fuels and vehicles
Energy, Emissions are Key Impacts of So Much Travel - BUTMany Other Transport–Land Use Issues are Equally Urgent • Maintaining accessibility is critical to economic and social wellbeing. • But current methods of providing it have too many negative externalities: • Adverse impacts of highways, airports: land takings: habitat disruption, severance, noise, neighborhood disruption, exposure to emissions • Traffic congestion & delays are stressful, costly • Role of highways in fostering sprawl is an issue • Cost is high and so is resistance to public funding
Some dilemmas • Travel is outstripping street and highway capacity but community opposition to added capacity is often vociferous • Congested traffic wastes energy but encourages mixed use, compact growth, trip chaining, use of other modes • Transit can use more energy than autos in low density areas (less than 10-15 du/acre) • In some markets, ridesharing draws more users from transit than from cars • Walk trips are mostly under ½ mi., bike trips mostly under 3 mi. – need clusters of activity reachable in such distances or these modes don’t work well
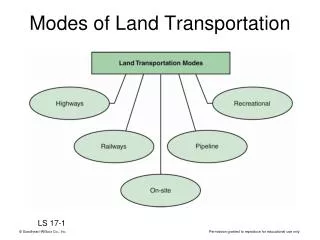
Strategies for reducing transport impacts • Clean(er) fuels • Clean(er) vehicles • Reduced travel by high-impact modes (mode shift strategies) • Shorter trips (land use strategies) • Fewer trips (e.g., through telecommuting, teleshopping, teleconferencing, trip chaining)
How we’ve implemented these strategies: • Clean fuels, CAFÉ standards, emissions standards: international, federal and state programs since 1970s - with some hiccoughs • Investments in transit and other modal alternatives – partly driven by environmental concerns since ~70s • Transportation Control Measures (since 1970 CAAA – 40+ years, many plans, analyses,…) • Highway funding has outstripped funding for alternatives ~10-1 • Scenarios, Visions, Blueprints: coordinated land use and transportation plans designed to address affordable housing problems, reduce traffic, improve neighborhood quality, improve economic performance of older communities, achieve Clean Air Act conformity – mostly since 1990s in US; implementation relies on funding for transit, etc.
What Have We Learned? Results Are Mixed… • Large savings from CAFÉ standards & emissions controls, though both faced opposition, delays in implementation • growth has offset some of benefits from fuel and vehicle standards – also small rebound effect • TCMs have only been partially implemented, for modest savings from in most areas • Analyses show transport pricing and integrated transportation-land use strategies could be effective at curbing demand, but neither has been popular (limited implementation so far) What will be needed to make implementation much more effective this time around? “Those who cannot remember the past are condemned to repeat it .”
Key Issues in CA Transportation Policy Today Debates over direction, e.g.: • facilitate traffic flow or calm traffic & redesign streets to be multimodal • price congestion out of system or add capacity to alleviate it • invest in transit or focus on new technologies for highways • HSR vs. air & auto travel • clean up trucks or move freight to rail • Costs, service levels, financing stability all big issues – lead to additional uncertainties about future options • For many transport decisions, effects on economic development opportunities, growth patterns, congestion, air pollutant emissions, community impacts more important policy considerations than CO2 or energy
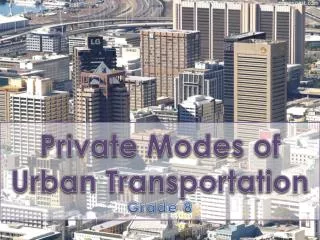
II A closer look at mode shift strategies • Invest in transit, ridesharing, bike, pedestrian facilities • Reduce subsidies for parking • Provide commute allowances rather than parking spaces • Increase costs of auto use to capture externalities: tax fuels, price congestion, charge for VMT, require full mitigation paid by users • Make auto costs visible and vary with use, e.g. pay as you go insurance, rental cars, car sharing • Change land use patterns to make bike, walk, transit feasible and desirable
The Importance of Reductions in VMT in CA 2000-2030Illustrative Example of Importance of LDV Usage (VMT)
Barriers are Plentiful… • Public opposition to higher transport taxes is very high • Tolls, congestion pricing can’t be implemented without legal changes on most facilities • Most parking is provided free of charge, and many employers and retailers see this as a business necessity • Fuel-efficient vehicles reduce emissions and energy use, but still have other negative impacts • Markets for density?? The single family detached house has been the American dream (somewhat tarnished by foreclosures, but still strong) • High density mixed use raises concerns about costs, impacts even in cities that are generally supportive • Transit is in a funding crisis and making cuts, yet more service is needed to support infill and higher density
Yet Opportunities Also Abound • Transit is widely supported by voters • Transit-oriented development and infill have been successfully implemented in many cities, and more have plans in the works • Many cities are improving bike and pedestrian facilities • Increasing use of toll lanes, pricing strategies • Higher density urban living is preferred by “creative class”; can also be a way to provide more affordable housing for renters
Some very pleasant places have high densities, mixed uses, and a high share of travel by transit, bike, and walking!
Example: Peak-Off-peak Toll on Bay Bridge • First proposed in 1990s, Legislature would not approve • In ensuing years legislature gave region authority to set tolls • July 2010: Toll authority increased am and pm peak toll to $6, leave off-peak at $4 (very modest congestion charge) • Charge carpools in carpool lanes 50% of peak tolls and require transponder • Effects- reduced delay ~ 3 min. at toll plaza, moved some travelers to shoulders of peak and some to BART
Bay Bridge Travel Delay (AM Peak) • Maximum delay traveling to the Bay Bridge Toll Plaza has decreased from about 27 minutes in May 2009 to about 24 minutes in Sept/Nov 2010, representing a imesavings of about 11 percent.
Congestion Pricing Impacts 23 Bay Bridge Traffic Volumes (AM Peak) • Since the onset of congestion pricing on the Bay Bridge, there is: • Slightly more traffic during the 4 to 5 a.m. hour; • Slightly less traffic during the 5 to 10 a.m. peak period; and • Slightly more traffic after 10 a.m. 23 B A Y A R E A T O L L A U T H O R I T Y
Transit Ridership Impacts 24 BART Weekday Hourly Transbay (Westbound Direction) • AM Peak (5-10 AM): +3,600 passengers, or +8% • PM Peak (3-7 PM): +400 passengers, or +3% • All Day (4 AM - midnight): +4,600 passengers, or +6% • AC Transit weekday transbay ridership remained flat 24 B A Y A R E A T O L L A U T H O R I T Y
Demand Management Trends; Cautious Increase in Daring Deeds? • HOT lanes in SCAG, SANDAG, and MTC region • Variable parking pricing demonstration projects • Deep discount transit passes for students, employees • Cell phone apps for dynamic ridesharing • Bike plans & programs proliferating • Efforts to revamp arterials as context-sensitive “compete streets” • Transit-oriented development as both a land use and a transportation strategy
Provides effective service across a vast region Serves multiple employment centers Links to nascent rail system Addresses environmental justice concerns raised by bus cutbacks, rail investment Example: Los Angeles MetroBus
San Francisco Muni BRT Supplement to rail; deliver services fast: keep promises to voters Create rail-ready corridors Complete streets – peds, bikes, transit, cars
Land Use Trends • Mixed outcomes – growth on urban edge at low densities, but also considerable infill in many cities • Recent housing market crash & recession slowing / stopping development, time to recovery uncertain; best products currently are rental units • Transit-oriented development a growing expectation and aim in CA, and in many medium to large urban areas
:Example: Infill, TOD, Compact Growth? • Estimates of state-wide or region-wide efficacy modest at best – 1%-3% • Locally, however, much has been done in CA cities- and mode shares in these places are often 30-50% by alt. modes (2-3X that in car-oriented places) • Big questions: How big is the market for urban places? • What’s needed to move forward on larger scale?
Conclusions • Transportation-land use strategies backed up only with mild incentives and limited funding are likely to have very small impacts, but with a more consistent policy framework could be far more effective – 1% in weak case, up to 30% if efforts are stronger • The politics of change are hard but not impossible • R&D & analysis are important to select best policies, • outcomes also depend on developing funding priorities, and political will - consensus-building