Download
1 / 15
150 likes | 260 Vues
Methodology. Primary data source (Pro- Forma sent to Farmers). Financial data grouped in the following categories: Revenue Operating Costs Cost per litre Gross Margin Fixed Costs. CLASSIFICATION OF FARMS. Analytical Procedures. Compare relative production cost for

E N D
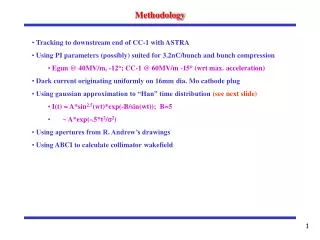
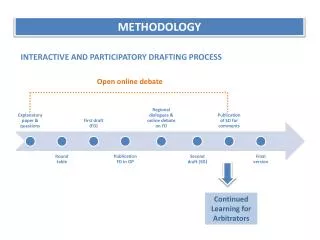
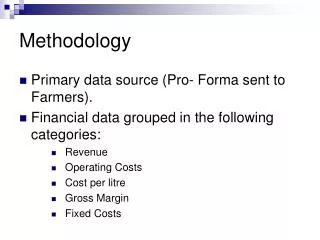
Methodology • Primary data source (Pro- Forma sent to Farmers). • Financial data grouped in the following categories: • Revenue • Operating Costs • Cost per litre • Gross Margin • Fixed Costs
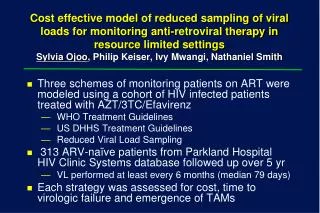
Analytical Procedures • Compare relative production cost for milk in all categories of farm size. • Compare major cost components as a proportion of variable cost. • Compare milk production at various stocking density across farms.
Variable Costs • Variable costs (operating costs) are expenses that change in proportion to the quantity of output of a business. • Variable costs include concentrate and other feeds, fertilizer, pasture maintenance, labour, veterinary services, chemicals, utilities, haulage, contract services and miscellaneous costs.
Gross Margin • Income above operating cost or contribution to fixed cost. • Another way of viewing is income after variable cost. • Gross Margin = Revenue – Variable costs
Fixed Costs • Fixed costs or overheads. These costs do not change with level of output. • Includes: Land charge, depreciation, interest on livestock investment, management costs. • The costs associated with owning a fixed input.
Table 1: COMPARISON OF VARIABLECOST PER LITRE AMONG FARM SIZES
TABLE 2: COMPARISON OF MEAN STOCKING RATES AND PRODUCTION /HA AMONG FARM SIZES
TABLE 3: COMPARISON OF LOCAL AND INTERNATIONAL COSTS OF PRODUCING MILK NB. Retail prices (USA.): Brian Gould, Agricultural & Applied Economics, UW Madison
TABLE 4:COMPARISON OF AVERAGE VARIABLE COSTS OVER THE PAST 7 YEARS ON MEDIUM & LARGE FARMS
TABLE 6: CHANGES IN PROPORTION (%) OF VARIABLE COST DUE TO THE VARIOUS INPUT CATEGORIES
TABLE 7: COMPARISON OF AVERAGE GROSS MARGIN/LITRE AMONG FARM SIZES
Summary and Conclusions • Average variable cost was J$ 46.93, an increase of 22% over 2008. • Non - irrigated farms averaged J$ 47.38. • Irrigated farms averaged J$ 43.55, ie 9% better than non-irrigated farms. • Large and medium farms margin -1.0 percent.
Conclusions • Fifty percent (53%) of farmers in the survey produced milk marginally above variable cost. • In the main, there was not sufficient margin to cover overhead. • High input costs particularly energy and feed were the main contributors.