Hypothesis Testing For Proportions
This guide explains hypothesis testing for proportions, focusing on P-values and their implications in statistical decision making. A P-value assesses how likely it is to observe data as extreme or more extreme than what is observed, given that the null hypothesis is true. A small P-value suggests strong evidence against the null hypothesis, while the relationship with significance levels (α) determines whether to reject or accept it. The process involves defining hypotheses, critical values, and conducting left-tailed, right-tailed, or two-tailed tests based on the alternative hypothesis.

Hypothesis Testing For Proportions
E N D
Presentation Transcript
P-Values of a Hypothesis Test • If the null-hypothesis is true, the P-value (probability value) of a hypothesis test is the probability of obtaining a sample statistic with a value as extreme or more extreme than the one determined from the sample data (farther away).
And then… • The smaller the P-Value, the more evidence there is to reject the null hypothesis. • A very small P-Value indicates a rare occurrence. • If the P-Value ≤ α, then you will reject the null hypothesis. • If the P-Value > α, then you will fail to reject the null hypothesis.
Tests… • If Ha contains <, the test is a left-tailed test. • P is the area to the left of the test statistic. • If Ha contains >, the test is a right-tailed test. • P is the area to the right of the test statistic. • If Ha contains ≠, the test is a two-tailed test. • P is the area to the left of the negative test statistic, and P is the area to the right of the positive test statistic.
Definitions • Hypothesis tests for proportions occur (for example) when a politician wants to know the proportion of his or her constituents who favor a certain bill or when a quality assurance engineer tests the proportion of parts which are defective. • Z-Test for a Proportion P: A statistical test for a population proportion P. It can be used when np ≥ 5 and nq ≥ 5. (q is 1-p) • A test statistic is the sample proportion p-hat. The standardized test statistic is z…formula to follow later.
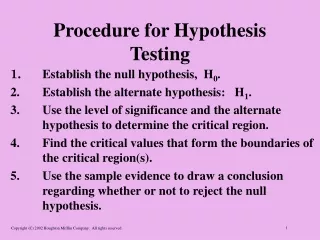
Steps to follow for a test… • Verify that np ≥ 5 and nq ≥ 5. If these are true, the distribution for p-hat will be normal and you can continue; otherwise you cannot use normal distribution for the problem. • State the claim…Identify null and alternative hypotheses. • Specify the level of significance (α). • Sketch the sampling distribution (make a curve).
More steps… • Determine any critical values (see next slide). These will be borders between rejection regions and non-rejection regions (below). They will be the same values each time. • Determine any rejection regions. These are a range of values for which the Ho is not probable. If a test statistic falls into this region, Ho is rejected. A critical value separates the rejection region from the non-rejection region.
More steps… • Find the z-score (standard score): • Make a decision to reject or fail to reject Ho. • Interpret the decision in the context of the original claim.
Example… • A medical researcher claims that less than 20% of adults in the U.S. are allergic to a medication. In a random sample of 100 adults, 15% say they have such an allergy. At α = 0.01, is there enough evidence to support the researcher’s claim? • n = 100, p = 0.20, q = 0.80 • 1. np = 20, nq = 80…you can continue. • 2. Ho: p ≥ 0.2, Ha: p < 0.2
Example (cont’d)… • Since Ha is <, this is a left-tailed test, and since α = 0.01, we will be using the critical value as -2.33 (they use the symbol zo for this). • See drawing on board for sketch. • The rejection region is z < -2.33. • The standardized test statistic (z) is:
Example (cont’d)… • Since z = -1.25, and this is not in the rejection region, you should decide not to reject the null hypothesis. • Interpretation: There is not enough evidence to support the claim that less than 20% of adults in the U.S. are allergic to the medication.
In your groups… • USA Today reports that 5% of US adults have seen an extraterrestrial being. You decide to test this claim and ask a random sample of 250 U.S. adults whether they have ever seen an extraterrestrial being. Of those surveyed 8% reply yes. At α = 0.01, is there enough evidence to reject the claim? • Your group is to complete and document all the steps to come to the final answer. This will be turned in.
Homework… • There will be some on Friday