Understanding Hypothesis Testing for Proportions in AP Statistics
This section covers the fundamentals of hypothesis testing for population proportions in AP Statistics. Learn how to conduct tests using the z-test when the conditions np ≥ 10 and n(1-p) ≥ 10 are met, ensuring a normal sampling distribution. Understand how to formulate hypotheses, calculate test statistics and p-values, and interpret results. Examples illustrate application in real-world contexts, demonstrating how to evaluate claims and make informed decisions based on statistical evidence.

Understanding Hypothesis Testing for Proportions in AP Statistics
E N D
Presentation Transcript
Hypothesis Testing for Proportions AP Statistics
Hypothesis Test for Proportions • In this section, you will learn how to test a population proportion, p. If np ≥ 10 and n(1-p) ≥ 10 for a binomial distribution, then the sampling distribution for is normal with and
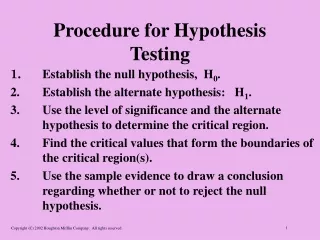
Steps for doing a hypothesis test • Assumptions • Write hypotheses & define parameter • Calculate the test statistic & p-value • Write a statement in the context of the problem. “Since the p-value < (>) a, I reject (fail to reject) the H0. There is (is not) sufficient evidence to suggest that Ha (in context).”
What is the p-value • The P-Value is the probability of obtaining a test statistic that is at least as extreme as the one that was actually observed, assuming the null is true. • p-value < (>) a, I reject (fail to reject) the H0.
How to calculate the P-value • Under Stat – Tests • Select 1 Prop Z-test • Input p, x, and n • P is claim proportion • X is number of sampling matching claim • N is number sampled • Select correct Alternate Hypothesis • Calculate
Reading the Information • Provides you with the z score • P-Value • Sample proportion • Interpret the p-value based off of your Confidence interval
Draw & shade a curve & calculate the p-value: 1) right-tail test z = 1.6 2) two-tail test z = 2.3 P-value = .0548 P-value = (.0107)2 = .0214
What is a a Represents the remaining percentage of our confidence interval. 95% confidence interval has a 5% alpha.
Ex. 1: Hypothesis Test for a Proportion • A medical researcher claims that less than 20% of American adults are allergic to a medication. In a random sample of 100 adults, 15% say they have such an allergy. Test the researcher’s claim at = 0.01.
SOLUTION • The products np = 100(0.20)= 20 and nq = 100(0.80) = 80 are both greater than 10. So, you can use the z-test. The claim is “less than 20% are allergic to a medication.” So the null and alternative hypothesis are: Ho: p = 0.2 and Ha: p < 0.2 (Claim)
Solution By HAND continued . . . • Because the test is a left-tailed test and the level of significance is = 0.01, the critical value is zo = -2.33 and the rejection region is z < -2.33. Using the z-test, the standardized test statistic is:
SOLUTION Continued . . . • The graph shows the location of the rejection region and the standardized test statistic, z. Because z is not in the rejection region, you should decide not to reject the null hypothesis. In other words, there is not enough evidence to support the claim that less than 20% of Americans are allergic to the medication.
Interpretation • Since the .1056 >.01, I fail to reject the H0 There is not sufficient evidence to suggest that 20% of adults are allergic to medication.
Ex. 2 Hypothesis Test for a Proportion • Harper’s Index claims that 23% of Americans are in favor of outlawing cigarettes. You decide to test this claim and ask a random sample of 200 Americas whether they are in favor outlawing cigarettes. Of the 200 Americans, 27% are in favor. At = 0.05, is there enough evidence to reject the claim?
SOLUTION: • The products np = 200(0.23) = 45 and nq = 200(0.77) = 154 are both greater than 5. So you can use a z-test. The claim is “23% of Americans are in favor of outlawing cigarettes.” So, the null and alternative hypotheses are: Ho: p = 0.23 (Claim)and Ha: p 0.23
SOLUTION continued . . . • Because the test is a two-tailed test, and the level of significance is = 0.05. • Z = 1.344 • P = .179 • Since the .179 >.05, I fail to reject the H0 There is not sufficient evidence to suggest that more or less than 23% of Americans are in favor of outlawing cigarette’s.
SOLUTION Continued . . . • The graph shows the location of the rejection regions and the standardized test statistic, z. • Because z is not in the rejection region, you should fail to reject the null hypothesis. At the 5% level of significance, there is not enough evidence to reject the claim that 23% of Americans are in favor of outlawing cigarettes.
Ex. 3 Hypothesis Test a Proportion • The Pew Research Center claims that more than 55% of American adults regularly watch a network news broadcast. You decide to test this claim and ask a random sample of 425 Americans whether they regularly watch a network news broadcast. Of the 425 Americans, 255 responded yes. At = 0.05, is there enough evidence to support the claim?
SOLUTION: • The products np = 425(0.55) = 235 and nq = 425(0.45) = 191 are both greater than 5. So you can use a z-test. The claim is “more than 55% of Americans watch a network news broadcast.” So, the null and alternative hypotheses are: Ho: p = 0.55 and Ha: p > 0.55 (Claim)
SOLUTION continued . . . • Because the test is a right-tailed test, and the level of significance is = 0.05. • Z = 2.072 • P-value = .981 • Since the .981 >.05, I fail to reject the H0. There is not sufficient evidence to suggest that 20% of adults are allergic to medication.
SOLUTION Continued . . . • The graph shows the location of the rejection region and the standardized test statistic, z. Because z is in the rejection region, you should decide to There is enough evidence at the 5% level of significance, to support the claim that 55% of American adults regularly watch a network news broadcast.