Download
1 / 42
420 likes | 566 Vues
Optimising Manufacture of Pressure Cylinders via DoE. Dave Stewardson, Shirley Coleman ISRU. Vessela Stoimenova SU “St. Kliment Ohridski”. This presentation was partly supported with funding from the 'Growth' programme of the European Community, and was

E N D
Optimising Manufacture of Pressure Cylinders via DoE Dave Stewardson, Shirley Coleman ISRU Vessela Stoimenova SU “St. Kliment Ohridski”
This presentation was partly supported with funding from the 'Growth' programme of the European Community, and was prepared in collaboration bymember organisations of the Thematic Network - Pro-Enbis - EC contract number G6RT-CT-2001-05059.
Background • German Company with site in Northumberland UK • Major producer of safety and breathing equipment • Fire-fighters a major customer
Main Objectives • Product Improvement • Compressed Air Cylinders • Carbon Fibre - Resin matrix is used to wrap Seamless Aluminium liner • ‘Wrapping’ process critical for producing Strong cylinders
Systematic Investigation To find optimum settings • Cylinders normally tested to Destruction • Second objective: • Find a non-destructive test!
Main Rationale of Designed Experiments • Experiment over a small balanced sub-set of the total number of possible combinations of factor settings • Minimum effort - Maximum Information
Sub-sets called Orthogonal Designs • Means ‘balanced’ • All combinations of factors investigated over an equal number of all the others • Known since 1920s after Fisher (UK) • Made Popular by Taguchi, a Japanese Engineer
Idea here to get a good mathematical model that predicts effect on cylinder of changing various factors • We can then find the optimum in terms of safety Vs profit Vs ability to make it • Minimum number of trials to do this
Want to Maximise life of cylinder • European Standard = prEN 12245 • Tested by varying internal pressure 0 - 450 Bar up to 15 cycles per minute up to total of 7500 cycles • MUST pass 3750 cycles or Fail test
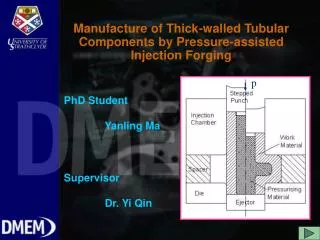
New Test Permanent Expansion after Auto-Frettage Via Water displacement test
Auto-Frettage Procedure • Fill cylinder with water • Now Pressurise • This deforms the liner • Stresses Carbon fibre • Improves cylinder resistance
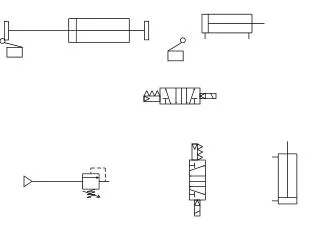
Four factors • Carbon Fibre • Winding Tension • Auto-Frettage Pressure • Resin Tack ‘Advancement’ Level
Experimental factors and their settings Factor Label Low (-1) High (+1) Carbon Fibre UTS UTS 5.4 Gpa 5.85 Gpa Resin Tack Level RT Low High Winding Tension WF 3.6 kg 4.5 kg Auto-Frettage pressure AF 580 bar 600 bar
If we choose only 2 levels of each Factor the total possible combinations is 16 We will run half of these, a balanced sub-set of the ‘full factorial’ 8
DoE • The statistical design of experiments is an efficient procedure for planning experiments so that the data obtained can be analyzed to yield valid and objective conclusions
Determine the objectives Select the process factors Well chosen experimental designs maximize the amount of information that can be obtained for a given amount of experimental effort The statistical theory underlying DOE generally begins with the concept of process models Linear models, for instance: Y=B0+B1*A+B2*B+B12*A+error Factors and responses STEPS
THE MODEL OF THE EXPERIMENT • Y = X*B + experimental error • X16x16 - design matrix • B - vector of unknown model coefficients • Y - vector consisting of the 16 trial response observations • XtX = I - orthogonal coding
Full factorial designs • A design with all possible high /low combinations of all the input factors is called full factorial design in two levels • If there are k factors, each at 2 levels, a full factorial design has 2kruns • we can estimate all k main effects, h-factor interactions and one k-factor interaction • cannot estimate the experimental error if we do not have replications
Fractional Factorial Designs • A factorial experiment in which only an adequately chosen fraction of the treatment combination required for the complete factorial experiment is selected to be run • balanced and orthogonal
Confounding • I = ABCD : generating / defining relation • Set of aliases: { A=A2BCD=BCD; B=AB2CD=ACD; C=ABC2D=ABD; D=ABCD2=ABC} • AB=CD; AC=BD; BC=AD
Effects are calculated by taking the average of the results at one level from the average at the other It is all very simple!
Permanent Expansion • Predicted by all the Main-effects alone • Cycle Life • Effected by ‘Interactions’
Predictive Equation Permanent Expansion = 53.54 - 1.85(UTS) + 2.7(RT) - 3.85(WT) + 3(AF) + e UTS, RT, WT, AF = 1 or -1
Cycle Life • Need to do four further tests to ‘untangle’ the interactions • However a plot of the UTS x WT interaction is given next – this assumes that the RT x AF interaction doe not exist
Findings • We can link the tests completely once the interactions are untangled • We can already predict how the factors effect Permanent Expansion • So we will be able to use the new test as a substitute for the destructive test
By choosing the ‘best’ settings for the manufacturing process, maximising Cycle life against cost, we can then use the new test. • For example: we know that if we choose mid levels for WT and AF then we can already predict Cycle life directly from the Permanent expansion alone.
In that case we know that as Permanent Expansion goes up by 1 unit then: • Cycle life goes up by at least 195 cycles, and by as much as 250 cycles, on average.