Download
1 / 1
10 likes | 104 Vues
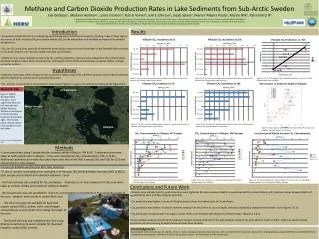
Study on CH4 and CO2 production in sub-Arctic lake sediments, examining core samples from lakes in Sweden. Results, hypotheses, methods, and conclusions discussed.

E N D
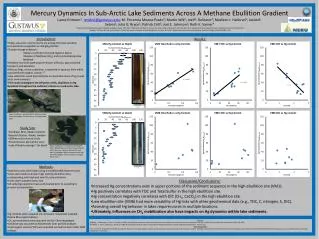
Methane and Carbon Dioxide Production Rates in Lake Sediments from Sub-Arctic Sweden Joel DeStasio1, Madison Halloran2, Lance Erickson3, Ruth K Varner4, Joel E Johnson5, Jacob Setera5, Maria F Meana Prado5, Martin Wik6, Patrick M Crill6 1. Departments of Natural Resources and the Environment and Earth Sciences, University of New Hampshire, Durham, NH, United States. 2. Department of Environmental Studies, Carleton College, Northfield, MN, United States. 3. Department of Geology, GustavusAdolphus College, St. Peter, MN, United States. 4. Institute for the Study of Earth, Oceans, and Space, University of New Hampshire, Durham, NH, United States.5. Department of Earth Sciences, University of New Hampshire, Durham, NH, United States. 6. Department of Geological Studies, Stockholm University, Stockholm, Sweden. • Introduction • Ecosystems at high latitudes are undergoing rapid change due to amplified atmospheric warming. Lakes in these regions are sources of both methane (CH4) and carbon dioxide (CO2) to the atmosphere and will likely be impacted by elevated temperatures. • CH4 and CO2 production potential of sediments were studied using cores from three lakes in the Stordalen Mire complex in sub-Arctic, Sweden: InreHarrsjön, MellanHarrsjön, and Villasjön. • Sediment cores were incubated to determine CO2 and CH4 production rates and were analyzed for CH4 concentrations, dissolved inorganic carbon (DIC) concentrations, total organic carbon (TOC) concentrations, as well as carbon, nitrogen and sulfur content. Results • Hypotheses • Sediments from areas within Villasjön known to have the highest rates of CH4 ebullition (western end of VM transect) will yield the highest CH4 concentrations and production rates. • CH4 and CO2 concentrations and production rates will be highest in organic rich sediments containing the highest TOC . Figure 3: CO2 flux rates for samples taken at eastern & western most points of transect VM. Samples taken from Villasjön. Figure 2: CO2 flux rates for samples taken at eastern & western most points of transect VM. Samples taken from Villasjön. Figure 4: CO2 vs. TOC weight % from samples taken from cores VI1 and VI2. Samples taken from Villasjön. TOC Content vs. Sediment Depth in Villasjön Research site: InreHarrsjön Figure 1 (Right): Stordalen Mire complex. The 2 uppermost lakes are InreHarrsjön and MellanHarrsjön. Villasjön is the largest of the three lakes, located at the bottom right. The marked points indicate where each sample core set was taken. Photo courtesy of Google Maps, 2013 MellanHarrsjön Figure 5: CO2 flux rates for samples taken at eastern & western most points of transect VM. Samples taken from Villasjön. Figure 6: CO2 flux rates for samples taken at eastern & western most points of transect VM. Samples taken from Villasjön. Villasjön Figure 7: Total organic carbon (TOC) content for VM & VP transect core samples. Samples taken from Villasjön. • Methods • Cores were taken along 2 perpendicular transects within Villasjön: VM & VP. 2 sediment cores were taken at each sample site in Villasjön. Cores were sampled for CH4 concentrations, TOC, S, N & C. Additional sediment cores were also taken from each end of the VM1 transect (VI1 and VI2) for CO2 and CH4 production rate analysis. Villasjön (VM Transect): InreHarrsjön & MellanHarrsjön (Sites MD1, MS1, ID1 & IS1): • 2 sets of samples were taken from each lake; InreHarrsjön (IS1 &ID1) & MellanHarrsjön (MS1 & MD1). Each sample set consisted of 4 individual sediment cores: • - The first core was sub-sampled for CH4 incubation . Duplicate 2 cm3 sub-samples from this core were taken at surface, middle and maximum sediment depths. • - The second core was sub-sampled for bulk CH4 concentration in increments of 5cm along the length of the core. Samples were stored in sealed 30mL vials. Figure 10: CH4 concentrations per sediment depth from cores ID1, IS1, MD1 &MS1. Samples taken from InreHarrsjön & MellanHarrsjön. Figure 8: CH4 concentrations vs. sediment depth along VP transect. Samples taken from Villasjön. Figure 9: CH4 concentrations vs. sediment depth along VM transect. Samples taken from Villasjön. Conclusions and Future Work • Villasjön cores indicate that CH4 production rates were highest at the same sediment depths as peak dissolved CH4 concentrations, with maximum values between depths of approximately 10cm and 30cm (Figures 5,6,8 & 9). • CH4 production was highest in areas of Villasjön known to have the highest rates of CH4 ebullition. • CO2 production was highest in surface sediments ranging from about 4cm to 11cm in depth, with rates displaying a steady decrease below 11cm (Figures 2 & 3). • CO2 production correlated with total organic carbon (TOC) concentrations with respect to sediment depth. (Figures 2-4 & 7). • Future isotopic analysis of sediment & headspace samples will help determine if the ages between sampled CH4 and sediment match or differ. Older CH4 would indicate production may be occurring at depths below what we have sampled. • The third core was sub-sampled for bulk total • organic carbon (TOC), carbon, sulfur and nitrogen concentrations in increments of cm along the length of the core. • - The fourth core was sub-sampled every 5cm using Rhizons to extract pore water samples for dissolved inorganic carbon (DIC) content. Acknowledgements Special thanks to Mr. Dana Hamel, Dr. and Mrs. Arthur G. Rand, Georgeann Murphy, Peter Akerman, ANS and the Northern Ecosystems Research for Undergraduates program (NSF REU site EAR#1063037) for making this project possible. Additional thanks to my research mentors, Dr. Ruth Varner and Dr. Joel Johnson Photo: Ruth Varner