Download
1 / 46
460 likes | 642 Vues
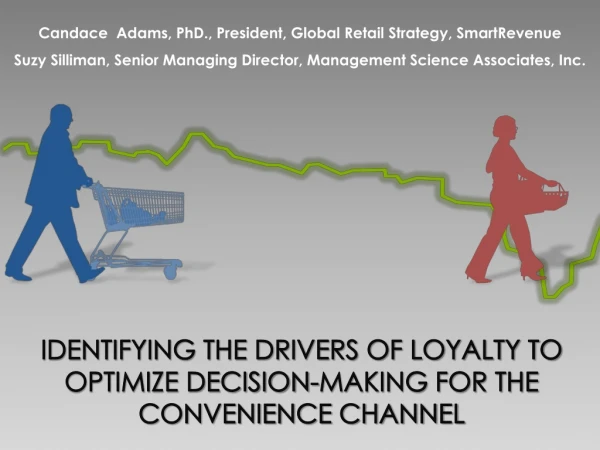
Candace Adams, PhD., President , Global Retail Strategy, SmartRevenue Suzy Silliman, Senior Managing Director, Management Science Associates, Inc. IDENTIFYING THE DRIVERS OF LOYALTY TO OPTIMIZE DECISION-MAKING FOR THE CONVENIENCE CHANNEL.

E N D
Candace Adams, PhD., President, Global Retail Strategy, SmartRevenue Suzy Silliman, Senior Managing Director, Management Science Associates, Inc. IDENTIFYING THE DRIVERS OF LOYALTY TO OPTIMIZE DECISION-MAKING FOR THE CONVENIENCE CHANNEL
SMARTREVENUE SmartRevenue Brings A Unique Combination Of People, Methods, And Technologies To Exceed All Project Objectives SMARTREVENUE
SmartRevenue Provides Comprehensive Insights, Strategies, And Solutions Along the Path to Purchase needs & attitudes media consumption recommendation intent pack communication product satisfaction re-purchase intent family satisfaction pack standout promotions signage loyalty familial legacy shopper type by category pre-shop occasion shelf layout channel choice retailer choice list-building shopping style shopping basket store atmosphere shopping route store experience store dynamics in-store advertising post-purchase in-store point-of-purchase SMARTREVENUE
About MSA Providing information-based solutions that integrate strategic thinking, information technology, and analytics. • cciPanel • Innovative mobile research panel of convenience store shoppers • Captures purchase decisions, behaviors, and attitudes • Zeroes in on the channel’s most likely shopper, the 18-34-year-old • Optimal Item Assortment • Store specific item assortments that maximize category profits • Trade Promotion Allocation • Store-level promotion allotments based on responsiveness to programs • Cross-Product Purchase Influence and Price Elasticity • Which items increase the total sale and at what optimal price-point? • eOrder Clearinghouse • Automating the pre-book and void resolution process throughout chainMl • Retailer web portal (joint offering between MSA and CSP)
Convenience Channel Services • cciPanel • Innovative mobile research panel of convenience store shoppers • Captures purchase decisions, behaviors, and attitudes • Zeroes in on the channel’s most likely shopper, the 18-34-year-old • Optimal Item Assortment • Store specific item assortments that maximize category profits • Trade Promotion Allocation • Store-level promotion allotments based on responsiveness to programs • Cross-Product Purchase Influence and Price Elasticity • Which items increase the total sale and at what optimal price-point? • eOrder Clearinghouse • Automating the pre-book and void resolution process throughout chain • Ml • Retailer web portal (joint offering between MSA and CSP)
The Retail Landscape Is More Challenging Than Ever • Consumers lack confidence as they face economic hardship and high unemployment • In the face of economic contraction, the retail landscape appears filled with all too many channels (migration), banners, and SKUs (consumption) • Consequently, retailers need precise and differentiated analytics to optimize: • Capital planning • Branding • Marketing communications • Merchandising • Assortment planning • Operations
Retailer Loyalty Defined The biased (i.e. non random) behavioral response (i.e. revisit), expressed over time, by some decision-making unit with respect to one store out of a set of stores, which is a function of psychological (decision making and evaluative) processes resulting in brand commitment.
Important to Understand Drivers of Loyalty Across Channels Media/Communication Influences Service Convenience Shoppability In-stock position In-Store Point-of-Purchase Post-Shop Pre-Store Purchase Corporate Image Family Dynamics Store Associates Variety/ Assortment Loyalty Overall Quality Segment Web Presence Product Quality Overall Shopping Experience BrandEquity Green/Local Sourcing Store Environment Product Displays Retailer Value Proposition Unique/Innovative Products Food Drug Mass Club Convenience Dollar Departments/Department Stores: Home Improvement, Electronics, Office Supply, and Apparel
Sample • Robust, nationally representative sample • 8,500 US shoppers: • Grocery in past 30 days (regional grocery included) • Drug, Mass, Convenience, Dollar, Club in past 60 days: • Convenience Banners: • 7-Eleven • Speedway • Wawa’s • Shell • BP/Amoco • Circle K • Exxon/Mobil/On the Run • Department Stores or Departments within stores past 90 days including: • Electronics • Apparel • Home Improvement • Office Supply
Questionnaire Outline • Segmentation Questions/Algorithm • Shopping behaviors (i.e., list building and coupon clipping) • Price, Brand, Environmental, Health Conscious Drivers • Use of digital and on-line • Importance of web presence and green or local sourcing • Pre-Store Variables • Influence of media and family • In-Store Variables • Customer service, shopping experience, staff helpfulness/knowledge • Point of Purchase Variables • Product availability, assortment, and quality; role of national brands • Post Purchase Variables • Channel performance on key brand equity measures • Loyalty Composite • Overall satisfaction, likelihood to recommend, store substitutability
Factors Behind Trips & Loyalty Are Inter-related; traditional methodology naively assumed linearity • Assumes linearity • Can only examine direct effects • Measure are one dimensional • Doesn’t account for temporality Store Associates Navigation Quality of Products ShopperLoyalty Unique/Innovative Products Store Environment Overall Shopping Experience Assortment Corporate Image
Providing Leadership to Retail Partners • INSIGHTS • What drives store, department and category loyalty • Quantification of key drivers to know which will return greatest ROI • Prioritization of marketing, merchandising and operations spending • Research by McKinsey, Forrester and others has shown that a better customer experience drives improvement for three types of customer loyalty: willingness to consider another purchase, likelihood to switch business to a competitor, and likelihood to recommend to a friend or colleague. • SmartRevenue has been successful in helping retailers prioritize marketing and merchandising spend to increase ROI by understanding drivers of loyalty using structural equation modeling (SEM). In our research, loyalty is a composite of four variables: Overall Satisfaction, Quality of the Overall Shopping Experience, Ease of Switching, and Likelihood to Recommend. • SEM allows you to quantify the relative contribution of variables along the path to purchase to understand where to expect the greatest impact or ROI. • Understanding the priority of these variables and how they are interrelated, Nestle will be able to provide thought leadership to its retail partners and help them better target decision-making pre-store, in-store and post purchase • RETAILER STRATEGY & SOLUTIONS • Win in the consideration set • Increase Trip Frequency • Encourage Aisle Crossing/Cross Shopping • Improve Closure Rates • Identify Conversion Opportunities • RETAILER STRATEGY & SOLUTIONS • Growing trips and basket size • Enhancing the shopping experience • Providing relevance to its shoppers • Differentiating themselves from other brands • BRAND STRATEGY & SOLUTIONS • Help key customers grow trips and basket • Understand the business impact of marketing and trade spend • Grow categories and brands
PRICE / VALUE UNIQUE/ INNOVATIVE PRODUCTS CORPORATE IMAGE QUALITY OF PRODUCTS LOYALTY QUALITY RATING NAVIGATION STORE ENVIRONMENT OVERALL SHOPPING EXPERIENCE STORE ASSOCIATES ASSORTMENT Advanced Analytics Used Key Metrics • DRIVERS OF LOYALTYalong the path to purchase identify which levers and strategies optimize marketing, messaging, and merchandising to: • Drive investment strategy based on high-impact levers • Scorecard select retailers/channels against other retailers/channels • Optimize assortment, product mix, and store layout • Drive pre-store and in-store communications
The SEM Model Also Identifies Which Drivers Will Generate A Greater Return Of Investment Price /Value Quality of Product $35 mm Variety of Assortment $33 mm Store Associates $31 mm Corporate Image $23 mm Overall Quality $9 mm $8 mm
Advanced Analytics Used Key Metrics • PERFORMANCE SCORECARDS to: • Develop strategies around relative competitive positioning • Identify opportunities for differentiation • Shift share from competitors • Determine which segments are the most profitable
Cross Channel Findings CROSS CHANNEL FINDINGS
Convenience Channel Findings CONVENIENCE CHANNEL FINDINGS
While convenience drives trips, it is not the key to loyalty
Loyalty Drivers: All Retail vs. Convenience All Retail Convenience
Implications of Convenience Loyalty Drivers • Many of today’s leading Industry initiatives can be validated by the ranking of loyalty drivers across Convenience Stores: • Efficient Assortment/Focus on Core influence shopablility and quality of products • Emphasis on better servicing the Independent impacts corporate image • Education and automation fosters higher levels of service • Stocking National Brands assures high quality of products offered • Trade Promotions passed through to the consumer levels the playing field for price/value • Social Media Engagement helps to build equity and improve corporate image
Grocery & Drug Outperform: Potential Convenience Encroachment
Retailer Equity Defined • The differential effect of store knowledge on customer response to the marketing activities of the store • First, the differential effect of the brand is determined by comparing consumer response to the marketing of a brand with the response to the same marketing of a fictitiously named or unnamed version of the product or service. • Second, brand knowledge is defined as brand awareness and brand image, characterized by conceptualizations and relationships among brand associations. • Third, consumer response to marketing is defined as consumer perceptions, preferences, and behavior arising from marketing mix activity (e.g., brand choice).
Retailer Equity Defined In sum, “a brand is said to have a positive (negative) customer-based brand equity if consumers react more or less favorably to the product, price, promotion, or distribution of the brand than they do to same marketing mix element when it is attributed to a fictitiously names or unnamed version of the product or service”
Dimensions of Brand Equity • Affect • (Feelings) • Feel Confident • Feel Good Shopping Store • Feel Comfortable • Feel Smart • Cognition • (Thinking & Judging) • Trust • Dependability • Keeps promises • Reliability • Operations • (Production/Performance) • Easy to shop • Good customer service • Layout • Perceptions • (Beliefs) • Can recommend to friends • Pleasant atmosphere
Advanced Analytics Used Key Metrics • EQUITY INDEX calculated across 4 dimensions: affect, cognition, operations and perceptions. Can: • Tie to loyalty, trips and other business metrics (develop correlation coefficients) to grow the company • Develop differentiated marketing, merchandising and operations strategies • Benchmark brand equity against best-in-class retailers
Factors Driving Brand Equity for Convenience • Compared to Food, Drug, Dollar and Mass Channels, the Convenience Channel was rated lowest on all dimensions of brand equity • This creates vulnerability for channel migration to Drug or small format Mass Merch/Grocery who are encroaching on traditional Convenience territory • While lower than other channels, scores were comparable on image perceptions but less so on operational and emotive (feelings) variables • And although equity is a key driver for Retailer Loyalty within Convenience, it is not the only driver • 2 of the Top 3 “Equity” Retailers rank in the bottom “Loyalty”
“So What?”….for you, the Manufacturer Media/Communication Influences Service Convenience Shoppability In-stock position Drivers most influenced by Manufacturers In-Store Point-of-Purchase Post-Shop Pre-Store Purchase Corporate Image Family Dynamics Store Associates Variety/ Assortment Loyalty Overall Quality Segment Web Presence Product Quality Overall Shopping Experience BrandEquity Green/Local Sourcing Store Environment Product Displays Retailer Value Proposition Unique/Innovative Products Food Drug Mass Club Convenience Dollar Departments/Department Stores: Home Improvement, Electronics, Office Supply, and Apparel Why should you care about Retailer Loyalty? You have your own portfolio of brands to build equity and consumer loyalty for!
“So What?”….for you, the Manufacturer • Isn’t building Retailer Loyalty the Retailer’s responsibility? • As Channel Leaders, you have a commitment to see that the Industry remains viable • Sharing your knowledge with Convenience stores will facilitate stronger collaboration and trust – build better partnerships • Can positively impact many of the top drivers • Profit margins for products sold through Convenience are healthy for Manufacturers; mitigate the risks of the convenience shopper migrating to a more deal/price sensitive channel for those same purchases • A loyal shopper is a satisfied shopper. A satisfied shopper will spend more time in store and make more store visits, therefore improving the odds that they will purchase one of your products on impulse and drive sales growth for you, the Category, and Retailer
CONCLUSIONS • Across all drivers of retailer loyalty, the convenience channel falls behind all others; the convenience factor is the only exception • Importance of Drivers Differ for Convenience
CONCLUSIONS • WaWa, Speedway and RaceTracrepresent the top 3 convenience banners. • Speedway matched WaWa’s scores on a couple of drivers (e.g., in-stock position and assortment) • Speedway’s positioning likely influenced by being one of the first to embrace a customer loyalty program • The bottom 4 banners were 7-11, BP, Exxon and Circle K • Convenience lags the aggregate on total retail on all drivers of loyalty except convenience. The risk here is possible shopper migration to other channels (e.g., Walgreens, small format mass/grocery, etc.)
CONCLUSIONS • Equity is a leading driver of Loyalty, but not the exclusive driver • So, basically we are defining equity in this context as the "r-factor" that causes a shopper to select one store over another if all other dynamics regarding the marketing mix, etc. are equal. This is more of an emotional influencer. • As with loyalty, the Convenience channel rated lowest on all dimensions of equity. (This again, adds to the vulnerability of channel migration.) • The dynamic retailer loyalty equation has some specific drivers that the Manufacturer (and Distributor) can directly influence. Most of these fall into point-of-purchase factors and include in-stock position, assortment, product quality, product displays. But there are many other areas that a less direct influence can still be achieved. • The Manufacturer/Vendor might not realize that they should or why they should care about helping the Retailer build loyalty, but we’ve identified some high-level win-win's for those "so-what's"...basically a loyal and satisfied shopper will buy more!
SMARTREVENUE insights strategies solutions thank you Candace R. Adams, PhD President, Global Retail Strategy 203-247-5241 candace.adams@smartrevenue.com