About & Installation
Intro To Zabbix. David Crawford d@v1dc.me November, 2011. About & Installation. - Zabbix is more than 10 years old now, but since the project is based in Latvia we have only seen it increase in popularity over the past few years.

About & Installation
E N D
Presentation Transcript
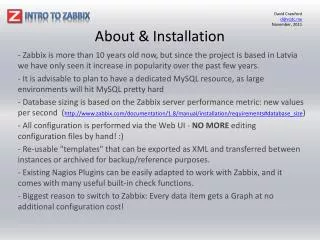
Intro To Zabbix David Crawford d@v1dc.me November, 2011 About & Installation - Zabbix is more than 10 years old now, but since the project is based in Latvia we have only seen it increase in popularity over the past few years. - It is advisable to plan to have a dedicated MySQL resource, as large environments will hit MySQL pretty hard - Database sizing is based on the Zabbix server performance metric: new values per second (http://www.zabbix.com/documentation/1.8/manual/installation/requirements#database_size) - All configuration is performed via the Web UI - NO MORE editing configuration files by hand! :) - Re-usable "templates" that can be exported as XML and transferred between instances or archived for backup/reference purposes. - Existing Nagios Plugins can be easily adapted to work with Zabbix, and it comes with many useful built-in check functions. - Biggest reason to switch to Zabbix: Every data item gets a Graph at no additional configuration cost!
Intro To Zabbix David Crawford d@v1dc.me November, 2011 Architecture - Zabbix is written in PHP (Web UI) and C (server & agent) - supporting an Oracle, DB2, PostgreSQL, MySQL, or SQLite backend. - Versus Nagios: Nagios only maintains the current state of affairs - Zabbix maintains a running value history that can be used to detect changes or produce graphs. Over time these values are compressed into trends to save space - the retention period is configurable "per item". - Supports collection via Zabbix Agent, SNMP, IPMP, SSH/Telnet agents or Simple Checks (typically network connection tests) - Active versus Passive Checks: * Passive: The traditional method of the monitoring server probing the client at regular intervals * Active: The client runs the check periodically & connects to the Zabbix server to upload the results, better suited for machines in heavily firewalled network segments with limited inbound access. - Basic components broken down into: Applications, Items, Triggers & Actions. - Let's not forget about Graphs & Web Monitoring! :) - Support for auto-discovery of new machines added to your infrastructure! (Actions can be created against discovery events to create the new host and apply the desired templates to the machine AUTOMATICALLY!)
Intro To Zabbix David Crawford d@v1dc.me November, 2011 Load Balancing & Redundancy Distributed Monitoring: - DM mode allows items to be "distributed" over multiple Zabbix Server nodes to even out the load of collecting values from your environment. Proxy Monitoring: - Ideal for several small to medium sized installations spread over multiple facilities - a Zabbix Proxy server runs inside each rack, collects values from all machines in that enclosure and then "calls home" to upload large batches of values to the Master Zabbix Server every few minutes. This setup is also highly desirable from a network security perspective, since only one inbound port to the Master Zabbix server needs to be open to receive new data from the public internet if a private link or VPN tunnel does not exist. - This allows all items to be seen from a single master Zabbix Web UI instance - eliminating the need to switch back and forth between multiple Nagios browser tabs to see your "entire" environment as a whole. Redundancy: - I haven't seen a good redundant installation guide for Zabbix with automatic failover, however you can still make the (hardware layer) redundant using other more traditional methods.
Intro To Zabbix David Crawford d@v1dc.me November, 2011 Trigger Expressions - Versus Nagios: Allows a threshold to be set for "warning" & "critical" - often numerical. - Zabbix provides more alert levels: Not Classified, Informational, Warning, Average, High, Disaster (To emulate old Nagios behaviour, create multiple triggers for each warning level you wish to generate) - Zabbix has created an entire trigger expression pseudo-language, with many powerful built-in functions. (http://www.zabbix.com/documentation/1.8/manual/config/triggers) - These algebraic expressions can incorporate more than one data item, and can even inter-mix data items from different hosts! (i.e. The Zabbix check on LB1 & LB2 that ensures lvs.cf matches on both machines using a vfs.file.cksum[] check of the file on both machines) - .min(T) .max(T) functions can be useful for eliminating chatter from "flapping" alerts to ensure multiple failures in a row before triggering. (Time T should be at least 3 times the data item update interval to include the most recent 3 checks)
Intro To Zabbix David Crawford d@v1dc.me November, 2011 Actions - Originate from 1 of 2 possible sources: Trigger Events & Auto-Discovery Events - Actions based on Auto-Discovery events creates & enables hosts after adding them to groups and apply the desired monitoring template(s). - Actions based on Trigger events can attempt to fire auto-recovery scripts/procedures on remote machines. - Actions based on Trigger events can also generate alerts via: * Traditional Email Alerts * Jabber Messages * SMS Messages via GSM modem - I like a balanced alerting schedule that sends me messages via Jabber during the day for almost all altering levels, and via email at night for all the high alerting levels (A,H,D). This way most of the “chatter” accumulates as Jabber messages during the day, and I don't overwhelm myself with too many email alerts (the last thing you want is a boy who cried wolf situation).
Intro To Zabbix David Crawford d@v1dc.me November, 2011 Graphs - Versus Cacti: Cacti is great as long as your data is sourced from SNMP devices. - Versus Nagios+Cacti: Requires Nagios, NDOutils, Cacti, & NPC (Nagios Plugin for Cacti) - and breaks almost every time you update your nagios.cfg! :( - All numerical data items have a "Graph" link next to them under "Latest Data" (contrasted with "History" for a chart of string values). - Create complex graphs with multiple data items (including the trigger threshold) as part of templates that get replicated to every host machine they are applied to.
Intro To Zabbix David Crawford d@v1dc.me November, 2011 Screens & Network Maps - Traditional Network Maps/Diagrams - Screens, or slideshows are ideal for putting together sets of graphs and tactical data that can display production performance stats on the LCD displays commonly mounted on development shop floors.
Intro To Zabbix David Crawford d@v1dc.me November, 2011 Web Monitoring - Create Web Monitoring checks that are comprised of a collection of web request "steps" (i.e. 1. request the login page, 2. login to my application, 3. click on my settings, 4. click on my reports, 5. generate a report, 6. logout) - These "steps" are executed using cURL, state is maintained using cookies. - Each step in the web monitoring check becomes a "time slice" in the finished web monitoring graph - Produces two different graphs: one for throughput rate & one for elapsed step time - This can be of very high value to development, as it shows them at a glance how the performance of their application degrades during the course of the day.
Intro To Zabbix David Crawford d@v1dc.me November, 2011 Database Monitoring Extensions - SmartMarmot.com makes Orbbix, Postbix, DB2bix, MySQLbix - Open Source solutions for monitoring database engines with Zabbix. - Recently all of the products above have been combined into one: DBforBix (http://www.smartmarmot.com/product/dbforbix/)
Intro To Zabbix David Crawford d@v1dc.me November, 2011 Solaris (Deep Integration) - UserParameters used in the zabbix_agentd.conf file to execute custom "check scripts" for very specialized monitoring. - UserParameters can also accept parameters, consider some examples used for our Solaris servers: UserParameter=solaris.disksuite,/export/home/zabbix/bin/disksuite2.pl UserParameter=solaris.temp[*],/export/home/zabbix/bin/temps.pl $1 UserParameter=solaris.eeprom[*],/export/home/zabbix/bin/eeprom.pl $1 - disksuite2.pl checks the state of the Solaris Software RAID (DiskSuite) - disksuite2.pl started life as a Nagios plugin downloaded from the Nagios Exchange (modified slightly for a cleaner output that would be easier to process as part of a Zabbix trigger) - temps.pl reads system board temperatures parsed from the output of `prtdiag –v`. - eeprom.pl reads EEPROM settings that control hardware boot-up (ensures auto-boot is enabled, that diagnostic mode is disabled, etc.)
Intro To Zabbix David Crawford d@v1dc.me November, 2011 Practical (Linux) Examples - Linux example from last week, when Development wanted to know what the open file handle count was on a machine just prior to a software issue that occurred... This could have been easily monitored with Zabbix using a simple UserParameter: UserParameter=linux.lsof_count,/usr/sbin/lsof | /usr/bin/wc -l - JBoss Monitoring with Zabbix: (http://skajla.blogspot.com/2010/07/jboss-monitoring-using-zabbix.html) - Log File monitoring: Zabbix can be used for centralized monitoring and analysis of log files with/without log rotation support. Notifications can be used to warn users when a log file contains certain strings or string patterns: log["/home/user/file.log","pattern_to_match","UTF-8",100] or logrt["/home/user/filelog_.*_[0-9]{1,3}","pattern_to_match","UTF-8",100] (http://www.zabbix.com/documentation/1.8/manual/log_file_monitoring) - Performance Tuning: (http://www.zabbix.com/documentation/1.8/manual/performance_tuning) - Basic Troubleshooting: (http://www.zabbix.com/documentation/1.8/manual/troubleshooting)
Intro To Zabbix David Crawford d@v1dc.me November, 2011 Conclusions - Graphs for your data items at no additional configuration cost == GOOD. :) - Not having to monkey around with the raw configuration files, re-usable templates that can be exported as XML. - Powerful trigger expressions that can relate multiple data items, even if they belong to separate client machines! - Zabbix > Nagios? What do you think?? // Extra: iOS Client: Mozaby

