Download
1 / 18
240 likes | 441 Vues
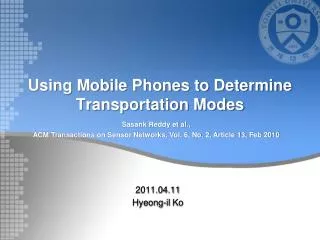
Transportation mode detection using mobile phones and GIS information. Leon Stenneth, Ouri Wolfson, Philip Yu, Bo Xu. Problem. Detecting a mobile user’s current mode of transportation based on GPS and GIS. Possible transportation modes considered are:. Technique.

E N D
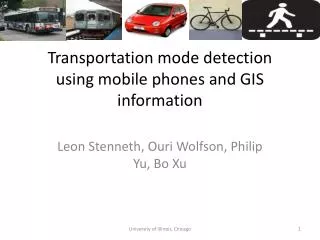
Transportation mode detection using mobile phones and GIS information Leon Stenneth, Ouri Wolfson, Philip Yu, Bo Xu University of Illinois, Chicago
Problem • Detecting a mobile user’s current mode of transportation based on GPS and GIS. • Possible transportation modes considered are: University of Illinois, Chicago
Technique • A supervised machine learning model • New classification features derived by combining GPS with GIS • Trained multiple models with these extracted features and labeled data. University of Illinois, Chicago
Motivation • Value added services to context detection systems • More customized advertisements can be sent • Providing more accurate travel demand surveys instead of people manually recording trips and transfers • Determining a traveler’s carbon footprint. University of Illinois, Chicago
Approach • In addition to traditional features on speed, acceleration, and heading change. We build classification features using GPS and GIS data University of Illinois, Chicago
Features • Traditional • Speed, acceleration, and heading change • Combining GPS and GIS • Rail line closeness • Average bus closeness • Candidate bus closeness • Bus stop closeness rate University of Illinois, Chicago
Rail line closeness • ARLC - average rail line closeness • Let {p1, p2, p3, p4…pn} be a finite the set of GPS reports submitted within a time window. ARLC= ∑i=1 to ndirail / n University of Illinois, Chicago
Average bus closeness (ABC) • Let {p1, p2, p3, p4…pn} be a finite the set of GPS reports submitted within a time window. ABC= (∑i=1 to ndibus) / n University of Illinois, Chicago
Candidate Bus closeness (CBC) • dj.tbus1≤j≤m - Euclidian distance to each bus busj • Dj- total Euclidian distance to bus j over all reports submitted in the time window Dj= ∑t=1 to ndj.tbus 1≤j≤m • Given Djfor all the m buses, we compute CBC as follows. CBC = min (Dj) 1≤j≤m University of Illinois, Chicago
Bus stop closeness rate (BSCR) • | PS | is the number of GPS reports who's Euclidian distance to the closest bus stop is less than the threshold BSCR= | PS | / window size University of Illinois, Chicago
Machine learning models • We compared five different models then choose the most effective • Random Forest (RF) • Decision trees (DT) • Neural networks (MLP) • Naïve Bayes (NB) • Bayesian Network (BN) • WEKA machine learning toolkit University of Illinois, Chicago
Results • Random Forest was the most effective model • Precision and recall accuracy of Random forest shown below University of Illinois, Chicago
Feature Ranking • Below we rank the features to determine the most effective. University of Illinois, Chicago
Results • Using the top ranked features only • Precision and recall accuracy is shown below University of Illinois, Chicago
Deployed System • We can provide further information (i.e. route, bus id) on the particular bus one is riding. University of Illinois, Chicago
Related work with GPS • Liao et. al (2004) – consider the user’s history such as where one parked. • Zheng et. al (2008) – Robust set of features and a change point segmentation method. • Reddy et. al (2010) – Combined accelerometer and GPS to achieve high accuracy. University of Illinois, Chicago
Conclusion • Using GIS data improves transportation mode detection accuracy. • This improvement is more noticeable for motorized transportation modes. • Only a subset of our initial set of features are needed. • Random forest is the most effective model • We can provide further information about the bus that a user is riding University of Illinois, Chicago