Download
1 / 36
360 likes | 497 Vues
I. Nature of Variation in Diet Methods. II. Overview of Dietary Methods. I Introduction on dietary variation. There is d ay-to-day variation in dietary intake. Long-term diet is used to be the exposure parameter to assess diet in epidemiologic applications. Period of time:

E N D
I. Nature of Variation in DietMethods II.Overview of Dietary Methods
I Introduction on dietary variation There is day-to-day variation in dietary intake. • Long-term diet is used to be the exposure parameter to assess diet in epidemiologic applications. Period of time: Years--- atherogenesis or cancer Weeks--- fetal malformation Days,weeks, or months---Physiologic intermediates(plasma lipids or endogenous hormone excretion)
Feature of the dietary intake --variation from day to day superimposed on an underlying consistent pattern
Factors contribute to daily variation in dietary intake: • Day of the week (ex large meals on Sunday) • Season(in developing countries without food preservation and transportation systems) ---The magnitude of influence is largely determined by cultural and ecological factors. ---Most of the variation in an individual’s diet is without an obvious pattern—random variation—true variation and measurement error(single day)
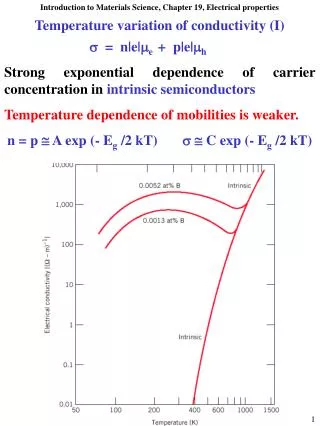
The degree of random variation differs according to nutrient: • Total energy intake—least day-to-day variation • Macronutrient—a somewhat constrained possibility for large degree of variation • Micronutrient—large variation (Fig 3-1) vitamine A> total fat, related to the level of intake
(Fig 3-2) The consumption of a specific nutrient for a single individual(within-person variation) (Fig 3-3) Distributions for mean daily intakes of total calories, total fat, and vitamine A for a group of 194 women(between-person variation) (Fig 3-4) a sample of one or several days----artificially increase the standard deviation---misleading report
The variation in daily intake of specific nutrient Daily Nutrient Yijk=μ + subjecti + factor Xij + day of weekijk +εijk • factor Xij –factorsthat influence within person variance, such as season and day of the week • εijk – random within person variance (day to day within person variance not explained by the other independent variables
(Table3-2, 3-3) major contributors to variance: subject(between person variance) and residule(ε:within person variance) Daily Nutrient Yijk=μ + subjecti +ε ε–day to day within person variance • within person variance/between person variance >=1(Table 3-4) within person variance: depending on populations(in U.S. (similar degree across age and age grouping)—high within person variance—Table 3-4,Table 3-5)
Seasonal variation ---not apparent in U.S., probably more apparent in Taiwan or China than in US. • Year-to-year variation—minor in comparison with day-to-day • Within-person-variation: random? Independent? --homeostatic mechanisms (probably both physiologic and cultural) -Autocorrelations(positive,negative) --Those with higher mean intakes have greater within-person variation.---transform data --possible nonindependence of intake on consecutive days --- sampling days at random intervals.
II.Number of days necessary to estimate true intake • Calculation of number of days: (the degree of accuracy, the variability of the studied nutrient) n=(ZαCVω/D0)2 n = the number of days needed per person Zα= the normal deviate for the percentage of times the measured value should be within a specified limit CVω= the within-person coefficient of variation = (SD/Mean)*100% D0 = the specified limit (as a percentage of long-term true intake) (table 3-6:CV)—may vary among different populations
(example) ---to calculate the number of days needed to estimate a person’s cholesterol intake to within 20% of their true mean 95% of the time: n=(1.96*62%/20%)2 =37 days -----beyond practical possibilities (Table 3-7) CVs are different for various nutrients
III. Implications for developing countries • More homogeneous—deserves examination(foods limited—income differences—increase between person variation) • Within developing countries, lower economic status has been shown to be associated with higher within-person variation. • Less able to adapt to temporatory short falls in income. Influence of season, preservation and transportation---provide excellent opportunities for epidemiologic studies of the relation between diet and health.---measure the important components of variation, such as seasonal effect)
誤差的種類 • 隨機誤差(收集重複樣本) • 系統誤差(和黃金標準比較)
隨機入內(within-person)誤差對相關研究的影響 • 分組錯誤(missclassification) • 扭曲相關係數、回歸係數、相對危險度 • 主要是減少相關強度 • 以一病歷對照研究為例 • 影響盛行率的估計,增加飲食資料天數,應可改善 • 應不影響平均值,但增大標準差。
系統誤差 • 使平均值偏差,但不改變摽准差 • 影響盛行率的估計,無法以增加天數改善。 • 不影響排列, • 不影響相關的結果
IV. Effects of random within person variation on measures of associations in epidemiologic studies Reducing the strength of association: correlation coefficients (example:0.62—0.28), regression coefficients (example:0.12—0.01), relative risks (example:2.36—1.51)
Attenuation of the relations Physiological variables R=0.96 R=0.65 * * * * * * * * Dietary intake level
Methods to estimate true correlation: 1. To use large number of replicate measurements for each individual and use the average. ---ex: within 10% of the true correlation—14 repeats 2. To make a small number of repeated measurements per subjects and use knowledge of the within-person variance (see Ch12).
Summary 1. Day to day variation in nutrient intake has consistently proved to be large. 2. The magnitude of variation varies according to nutrient. 3. Measurements of dietary intake based on a single or small number of 24-hour recalls per subject may provide a reasonable estimate of the mean for a group, but the SD will be overestimated. 4. Measurements of association (such as correlation and regression coefficients and relative risks) are weakened.
常用飲食/營養評估方法 Page 107 Chapter 5
評估方法分類 • 化學分析法 • Duplicate portion technique, aliquote sampling technique, equivalent composite • 食物成分表 • 紀錄法:precise weighing, weighted inventory, intake recorded in household measures • 訪問法:飲食回顧,飲食歷史,飲食頻率
評估方法分類 • Daily consumption methods • 飲食回顧法 • 飲食記錄法:precise weighing, weighed inventory, recorded in household measures。 • 化學分析法:duplicate portion technique, aliquot sampling technique, equivalent composite • Long-term dietary pattern • 飲食頻率法 • 飲食歷史 • 簡易飲食頻率 • 半定量飲食頻率
各種研究適用之方法 • 前瞻性研究 • 飲食頻率法,多次的飲食記錄/24小時回顧 • 回溯性研究 • 飲食頻率法 • 橫斷面研究 • 探討營養攝取現況:24-小時回顧法 • 探討飲食疾病關係:飲食頻率法 • 介入研究 • 飲食記錄、24-小時回顧法、簡易飲食頻率法 • 生態學研究 • 24-小時回顧法 另可參考 p133, section 6.6