Download
1 / 20
200 likes | 343 Vues
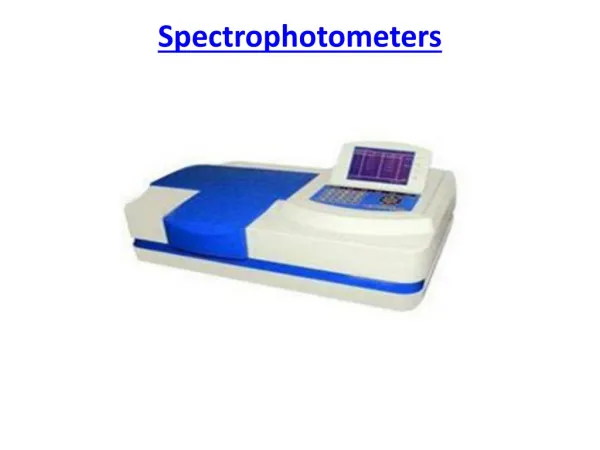
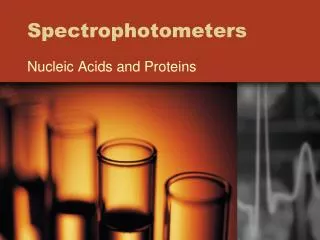
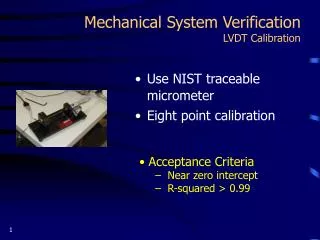
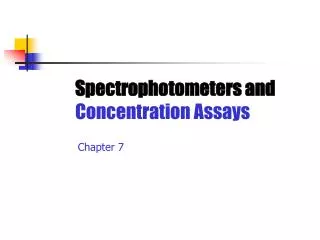
Calibration and verification of Spectrophotometers Alan Rielander INTERCAL. Basic scanning Spectrophotometer. Spectrum .

E N D
Calibration and verification of SpectrophotometersAlan RielanderINTERCAL
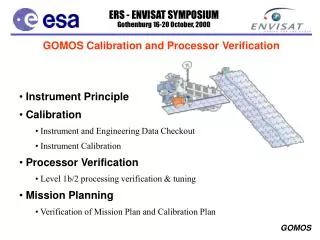
Spectrum • William Herschel (1738 - 1822) was one of the most important astronomers that ever lived. In 1800 he performed a famous experiment where he tried to measure the temperature of different colours of the spectrum by placing a thermometer on each colour. He found to his amazement that the hottest part of the spectrum was in a place where there was no colour at all. It was a spot beyond the red end of the spectrum. For the first time it was possible to talk about invisible light. This hot light became known as Infrared (below the red) because it was shown to have longer wavelength than visible light. Apart from its wavelength, Infrared has all the other properties of light. • After learning about William Herschel's discovery of infrared light, which he found beyond the visible red portion of the spectrum in 1800, Johann Ritter began to conduct experiments to see if he could detect invisible light beyond the violet portion of the spectrum as well. In 1801, he was experimenting with silver chloride, which turned black when exposed to light. He had heard that blue light caused a greater reaction in silver chloride than red light did. Ritter decided to measure the rate at which silver chloride reacted to the different colours of light. He directed sunlight through a glass prism to create a spectrum. He then placed silver chloride in each colour of the spectrum and found that it showed little change in the red part of the spectrum, but darkened toward the violet end of the spectrum. Johann Ritter then decided to place silver chloride in the area just beyond the violet end of the spectrum, in a region where no sunlight was visible. To his amazement, this region showed the most intense reaction of all. This showed for the first time that an invisible form of light existed beyond the violet end of the visible spectrum. This new type of light, which Ritter called Chemical Rays, later became known as ultraviolet light or ultraviolet radiation (the word ultra means beyond). [2] • The spectrum covered by UV-VIS spectrophotometers is from 180nm to 1100 nm • The ultraviolet spectrum is from 180nm to 340nm and the visible spectrum is from 340nm to 1000nm with some spectrophotometers going as far as 1100nm in the near infrared range. • The light sources are provided by a Tungsten-Halogen Lamp for the visible and a Deuterium lamp for the ultraviolet range. The Deuterium lamp provides Emission lines at 486 and 656.1, useful for instrument wavelength calibration and validation • The lamps provide a broad spectrum output and we need to split the spectrum into individual wavelengths to make measurements at precise measurements.
Manipulating the light source to our needs Diffraction of light using a prism
Diffraction grating The principles of diffraction gratings were discovered by James Gregory, about a year after Newton's prism experiments, initially with artifacts such as bird feathers. The first man-made diffraction grating was made around 1785 by Philadelphia inventor David Rittenhouse, who strung hairs between two finely threaded screws. This was similar to notable German physicist Joseph von Fraunhofer's wire diffraction grating in 1821.
Originally, high-resolution gratings were ruled using high-quality ruling engines whose construction was a large undertaking. Henry Joseph Grayson designed a machine to make diffraction gratings, succeeding with one of 120,000 lines to the inch (approx. 47 000 per cm) in 1899. Later, photolithographic techniques allowed gratings to be created from a holographic interference pattern. Holographic gratings have sinusoidal grooves and may not be as efficient as ruled gratings, but are often preferred in monochromators because they lead to much less stray light. A copying technique allows high quality replicas to be made from master gratings of either type, thereby lowering fabrication costs.
Filter wheel • Gratings produce second order spectrum which can interfere with our sample as they are not at the same wavelength we want to use. A filter wheel is positioned behind the slit to block the unwanted wavelengths of light getting through. These are order sorting filters and the filter wheel I controlled so that the relevant filter is in place for the portion of the spectrum we are working with.
Calibration • Wavelength calibration Spectrums of Holmium, Didymium and Samarium
Photometric accuracy in Visible • In 1970 the American National Bureau of Standards initiated the search for a standard using the following criteria. We want to use materials that are transparent in the range of interest usually between 200 and 800 nm, have a transmittance independent of wavelength(optically neutral), have a spectral transmittance independent of temperature, have low reflectance and free of interferences, be non fluorescent, be stable homogeneous and be free of strain, have mechanical stability for the size used, be easy to fabricate by conventional techniques used in optical shops, be simple to use in conventional spectrometers and be readily available and relatively inexpensive.[5] • Originally Corning 8364, Chance ON-10 and SCHOTT NG-4 Glass were initially selected from many glass types. SCHOTT NG Glass was finally selected since this material exhibits the best optical neutrality. • This glass is usually calibrated at 440.0nm, 465.0nm. 456.1nm, 590nm and 635nm at room temperature of 20.5°C and 25.5°C to check stability.
Neutral Density filters – Visible Spectrum Neutral Density filters
Potassium Dichromate - UV The use of potassium dichromate solvated in dilute perchloric acid is an established and well recognised method for the validation of the absorbance scale and linearity of a spectrophotometer in the UV region.
Metal on Quartz Filters - UV • Some manufacturers have produced metal on Quarts coatings for photometric accuracy testing in the UV. NIST SP 260-68 outlines the production of these filters. I have used these filters in the past but have found that the coating as very sensitive and can deteriorate easily.
Stray Light • Stray light can be described as an indication by the instrument of transmitted light at wavelength the monochromator is set to, when in reality there is no light being transmitted through the sample. This apparent transmission is caused by light of other wavelengths than that established by the monochromator being sensed by the detector, and usually results in non-linearity of an absorbance to concentration relationship. The poorer the stray light performance of an instrument the lower the absorbance value at which this correlation begins to deviate from a straight line. Stray light can be a problem at any wavelength but energy throughput of an instrument decreases, for example as you move into the UV region apparent stray light will become increasingly problematic. • The grating produces second order spectrum which is attenuated by the filter wheel. This light would interfere with the sample reading if allowed to pass through. This is just one possible source of stray light.
Alignment • The alignment of the cell holder is critical especially when using flow cells. Some manufactures use a10mm beam width and some use a focused beam. If the cell is out of alignment then some of the energy will be attenuated. This is especially critical with flow cells. In addition there are two standard beam heights. 8.5mm and 10mm. this is known as Z dimension. This is your beam height from the base of the cell.
Resolution standards • Ratio table:SBW (nm): • 0.5 1.0 1.5 2.0 3.0 • Ratio: • 2.5 2.1 1.6 1.4 1.0 Scan the 252-262 nm region, and observe the spectral changes with SBW.The 253.49 nm and 259.56 nm peaks should be visible at a SBW of 0.2 nm or less.