Download
1 / 23
230 likes | 333 Vues
Discovering Interesting Sub-paths in Spatiotemporal Datasets: A Summary of Results. Xun Zhou, Shashi Shekhar, Pradeep Mohan, Stefan Liess, and Peter K. Snyder xun@cs.umn.edu. Outline. Introduction Problem Formulation & Challenges Computational Solutions Experimental Evaluation

E N D
Discovering Interesting Sub-paths in Spatiotemporal Datasets: A Summary of Results Xun Zhou, Shashi Shekhar, Pradeep Mohan, Stefan Liess, and Peter K. Snyder xun@cs.umn.edu
Outline • Introduction • Problem Formulation & Challenges • Computational Solutions • Experimental Evaluation • Case Study • Conclusion and Future Work
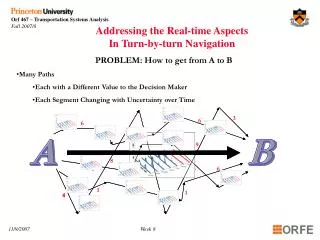
Sea level rise along coastal areas Mississippi river Speed profile along a trajectory on I-95 Source: http://scienceblogs.com/intersection/2009/01/federal_report_warns_of_rising.php Interesting ST Sub-path • Interesting subsets of ST paths • Climate Change • Transport Science • Environmental Monitoring Source: http://ops.fhwa.dot.gov/tolling_pricing/value_pricing/pubs_reports/projectreports/i95managedlanes/index.htm Source: http://blog.seattlepi.com/environment/
Vegetation Cover in Africa in NDVI (normalized difference vegetation index) A plot of vegetation cover along 18.5E longitude (the red line) from GIMMS vegetation dataset [1] W2 W1=[12N, 17N] W3 The change is enduringly abrupt Sub-path of Abrupt Change • Spatial sub-path of Abrupt Change • Sharp change in vegetation cover • Transition between ecological zones (ecotones) • Moves in response to climate change
Related Work Interesting Sub-path Discovery Interesting sub-path with arbitrary length (our work) Interesting point/unit sub-path 1-D: Change point detection, e.g., CUSUM[3] 2-D: Edge detection[4]
Our contribution • Formalize the Interesting Sub-path Discovery problem • A novel computational solution : SEP • Cost model and analysis on its performance • Case study in real application
Unit Sub-path : 1-2 2-3 3-4 4-5 5-6 6-7 7-8 8-9 9-10 10-11 11-12 Difference value: 7 -6 1 -1 5 5 4 -3 5 5 -11 Attribute value 1 8 2 3 2 7 12 16 13 18 23 12 Location 1 2 3 4 5 6 7 8 9 10 11 12 Problem Formulation: Basic Concepts • Sub-path: A contiguous subset of a path • Interesting Sub-path (ISP): (1). Interest Measure: Function Fspi(i, j) R, R is a real value. Fspi is an algebraic function[5] (e.g., mean=sum/count) (2). Interestingness test T: Fspi {True, False} (3). Example: “average increase is at least 3.5” • Unit sub-path: two neighboring locations, length = 1. • A value is associated with each unit sub-path. Aggregate Functions Distributive: SUM, COUNT. SUM(1, 5)= SUM(SUM(1,3), SUM(3,5)) Algebraic: AVG. AVG = SUM/COUNT. Holistic: MEDIAN • Dominant ISP (DISP): • An ISP that is not a subset of any other ISP. Slope of (5, 11) = 3.5 !
Unit Sub-path : 1-2 2-3 3-4 4-5 5-6 6-7 7-8 8-9 9-10 10-11 11-12 Difference value: 7 -6 1 -1 5 5 4 -3 5 5 -11 Problem Statement • Given • A path S in a ST framework with n unit sub-paths • A function f of values associated with each sub-path in S • A interestingness measure (algebraic function) Fspi: Rn R • A test function T: R {True, False} • Find • All the dominant interesting sub-paths (DISP) in S • Objective • Reduce computational cost • Constraints • Correctness & Completeness
Challenges • No pre-defined maximum length for DISPs • E.g., the length can range from 1 to then |S| • Pattern interestingness is lack of monotonicity • Interest measures are usually algebraic functions • E.g., sub-path (8, 9) in sub-path (5, 11). • The data volume can be very large. • Long time series/Fine resolution images. • GPS Trajectories.
Computational Solutions: Naive Approach Step 1: ISP identification • Exhaustively enumerate all the sub-paths • Scan each sub-path to compute and test the interestingness Step 2: Dominated ISP elimination • For each ISP in the candidate set, eliminate all the ISPs it dominates • Bottleneck 1: Repetitive scans of sub-paths to computer Fspi. • Bottleneck 2: Many dominated sub-paths are generated.
Unit Sub-path : 1-2 2-3 3-4 4-5 5-6 6-7 7-8 8-9 9-10 10-11 11-12 Difference value: 7 -6 1 -1 5 5 4 -3 5 5 -11 Computational Solution: SEP Approach • Solution 1: Build lookup tables for distributive functions • E.g., SUM(3,5)=SUM(1,5)-SUM(1,3) • Built in linear time, lookup in constant time • Reversible Aggregate Function[6] : sum, count, etc. • Solution 2: Design efficient enumeration strategies • Traverse the sub-path space in certain order • Following the dominance relationship • The Sub-path Enumeration and Pruning (SEP) Approach
1-2 1-3 2-3 1-4 2-4 3-4 1-5 2-5 3-5 4-5 1-6 2-6 3-6 4-6 5-6 1-7 3-7 4-7 5-7 2-7 6-7 1-8 2-8 3-8 4-8 5-8 6-8 7-8 7-9 8-9 1-9 2-9 3-9 4-9 5-9 6-9 7-10 8-10 9-10 1-10 2-10 3-10 4-10 5-10 6-10 7-11 8-11 9-11 1-11 2-11 3-11 4-11 5-11 6-11 10-11 7-12 8-12 9-12 10-12 11-12 1-12 2-12 3-12 4-12 5-12 6-12 SEP with Row-wise Traversal • Step 0: Build the lookup table by scanning the entire path • Step 1: Sub-path enumeration • Step 2: Dominated sub-path elimination {Identical to that of Naive Approach}
1-2 1-3 2-3 1-4 2-4 3-4 1-5 2-5 3-5 4-5 1-6 2-6 3-6 4-6 5-6 1-7 3-7 4-7 5-7 2-7 6-7 1-8 2-8 3-8 4-8 5-8 6-8 7-8 7-9 8-9 1-9 2-9 3-9 4-9 5-9 6-9 7-10 8-10 9-10 1-10 2-10 3-10 4-10 5-10 6-10 7-11 8-11 9-11 10-11 1-11 2-11 3-11 4-11 6-11 5-11 1-2 2-3 3-4 4-5 5-6 6-7 7-8 8-9 9-10 10-11 11-12 7-12 8-12 9-12 10-12 11-12 1-12 2-12 3-12 4-12 5-12 6-12 SEP with Top-down Traversal • Traversal space Grid-based DAG • A breadth-first traversal on the G-DAG • A node can be visited only if none of its predecessors is pruned. • Determine the number of predecessors 1 2 3 4 5 6 7 8 9 10 11 12 1 2 3 4 5 6 7 8 9 10 11 12
Experimental Evaluation(1) • Pattern Length Ratio (PLR) • Longest DISP’s length against total number of unit sub-paths Run time: Naive vs. SEP two designs. (1) PLR = 0.1 (worst case for SEP ) (2) PLR = 1 (best case for SEP top-down)
Experimental Evaluation(2) • Performance of the two traversal designs with PLR: 0.1 1 • Summary: • SEP is scalable & efficient compared to the Naive approach. • (2) Top-down outperforms row-wise when data has longer DISPs.
Case Study: Results on Spatial Paths • Interest Measure: “Sameness Degree (SD)” • “Average value change” against “average value change that >=Θa” Input : GIMMS vegetation cover in NDVI, Aug. 1-15, 1981, Africa. Output : Sub-paths with vegetation cover change in above data.
Conclusion and Future Work • Conclusion • SEP is a novel computational solution to the Interesting Sub-path Discovery problem • It is effective, efficient and scalable. • A cost model is studied to analyze the performance tradeoff. • Future Work • Improve algorithmic design and evaluation metric • Interesting Spatial-Temporal Regions. • Application on other domains (transport science, etc).
Acknowledgements and References • We would like to thank • ACMGIS reviewers • Sponsor of this work: NSF, USDOD • Spatial Database and Data Mining Group @ UMN • Kim Koffolt References [1] Tucker, C.J., J.E. Pinzon, M.E. Brown. Global inventory modeling and mapping studies. Global Land Cover Facility, University of Maryland, College Park, Maryland, 1981-2006. [2] Joint Institute for the Study of the Atmosphere and Ocean(JISAO). Sahel rainfall index. http://jisao.washington.edu/data/sahel/. [3] E. Page. Continuous inspection schemes. Biometrika, 41(1/2):100-115, 1954. [4] J. Canny. A computational approach to edge detection. Readings in computer vision: issues, problems, principles, and paradigms, 184(87-116):86, 1987. [5] S. Shekhar and S. Chawla. Spatial Ddatabases: A Tour. Prentice Hall, 2003 (ISBN 013-017480-7). [6] S. Cluet and G. Moerkotte. Efficient evaluation of aggregates on bulk types. In In Proc. Int. Workshop on Database Programming Languages, 1995
Vegetation Cover in Africa in NDVI (normalized difference vegetation index) Raw Sahel precipitation anomaly (JJASO)[2] A plot of vegetation cover along 18.5E longitude (the red line) from GIMMS vegetation dataset [1] Smoothed Sahel precipitation anomaly (JJASO) W2 W1=[12N, 17N] W3 The change is enduringly abrupt Sub-path of Abrupt Change • Temporal sub-path of Abrupt Change • Abrupt shift in precipitation, temperature, etc. • Climate change detection. • Spatial sub-path of Abrupt Change • Sharp change in vegetation cover • Transition between ecological zones (ecotones) • Moves in response to climate change
SEP with Top-down Traversal(2) • Determine the number of predecessors • Use an array to record the number of predecessors visited 11 2 1 0 1-2 2-3 3-4 4-5 5-6 6-7 7-8 8-9 9-10 10-11 11-12 5
SEP with Top-down Traversal(3) • Step 0: Build the lookup table by scanning the entire path • Step 1: ISP Identification • Step 2: Not Needed ptv[][] : predecessors to visit; Q[]: queue for breadth-first traversal; Q.Enqueue (S) While Q is not empty W = Q.pop() Compute Fspi(W) using the lookup tables If T(Fspi) == TRUE Then Output W Next Loop End IF For each successor (i, j) of W update ptv[i][j] If ptv[i][j]==0 Then Q.enqueue([i,j]) End For End While
Theoretical Analysis • n: Number of unit sub-paths
Case Study: Results on Temporal Dimension Temporal Sub-paths of abrupt precipitation change in the Sahel region, Africa.